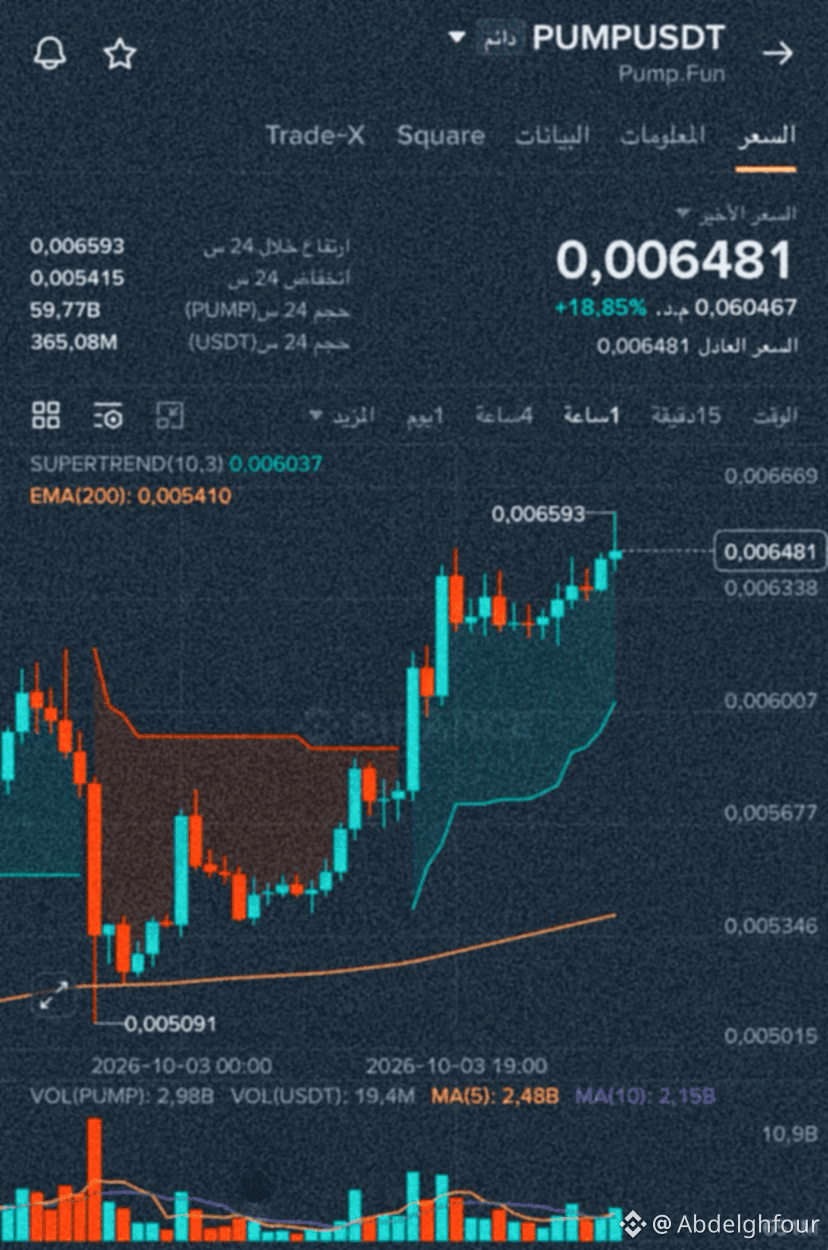
🔍 Comprehensive analysis of $PUMP /USDT$ (4H + 15m timeframe)
Based on the images you sent, here is a detailed reading of the indicators:
📊 1. Overall trend (4-hour timeframe)
• Price: 0.00650 (after a +18% rise in 24 hours).
• SuperTrend: still green at 0.0054, and the price is above it with a good distance = the overall trend is bullish.
• EMA 200: at 0.0045, and the price is above it = bullish trend.
• MACD: positive (DIF above DEA and above zero), but the histogram has started to shrink = upward momentum is weakening.
• RSI: at 80.97 = overbought. Historically, this zone precedes a correction.
• OBV: rising strongly = volume still supports the move.
📉 2. Timing (15-minute timeframe)
• SuperTrend: still green at 0.0062, and the price is above it = short-term buy signal.
• MACD: bearish crossover (DIF below DEA) = downward momentum in the short term.
• RSI: fell from 80 to 74.7 = cooling has started.
• OBV: rose and then dipped slightly = volume has begun to decline.
⚠️ 3. Funding and liquidity data
• Funding rate: 0.00500% (positive but very low) = no heavy crowding in Long trades.
• Liquidation map: high liquidity density at 0.00608 - 0.00629 (below the price) = price may be drawn toward it to liquidate Longs.
• Open Interest: high (4.7%) = traders are opening new positions.
💡 Summary and decision
The price is in an overbought zone (RSI 80), but the overall trend is still bullish.
• Don’t enter Long now: because RSI is high and the price may correct.
• Don’t enter Short immediately: because the overall trend is bullish
Based on the images you sent, here is a detailed reading of the indicators:
📊 1. Overall trend (4-hour timeframe)
• Price: 0.00650 (after a +18% rise in 24 hours).
• SuperTrend: still green at 0.0054, and the price is above it with a good distance = the overall trend is bullish.
• EMA 200: at 0.0045, and the price is above it = bullish trend.
• MACD: positive (DIF above DEA and above zero), but the histogram has started to shrink = upward momentum is weakening.
• RSI: at 80.97 = overbought. Historically, this zone precedes a correction.
• OBV: rising strongly = volume still supports the move.
📉 2. Timing (15-minute timeframe)
• SuperTrend: still green at 0.0062, and the price is above it = short-term buy signal.
• MACD: bearish crossover (DIF below DEA) = downward momentum in the short term.
• RSI: fell from 80 to 74.7 = cooling has started.
• OBV: rose and then dipped slightly = volume has begun to decline.
⚠️ 3. Funding and liquidity data
• Funding rate: 0.00500% (positive but very low) = no heavy crowding in Long trades.
• Liquidation map: high liquidity density at 0.00608 - 0.00629 (below the price) = price may be drawn toward it to liquidate Longs.
• Open Interest: high (4.7%) = traders are opening new positions.
💡 Summary and decision
The price is in an overbought zone (RSI 80), but the overall trend is still bullish.
• Don’t enter Long now: because RSI is high and the price may correct.
• Don’t enter Short immediately: because the overall trend is bullish