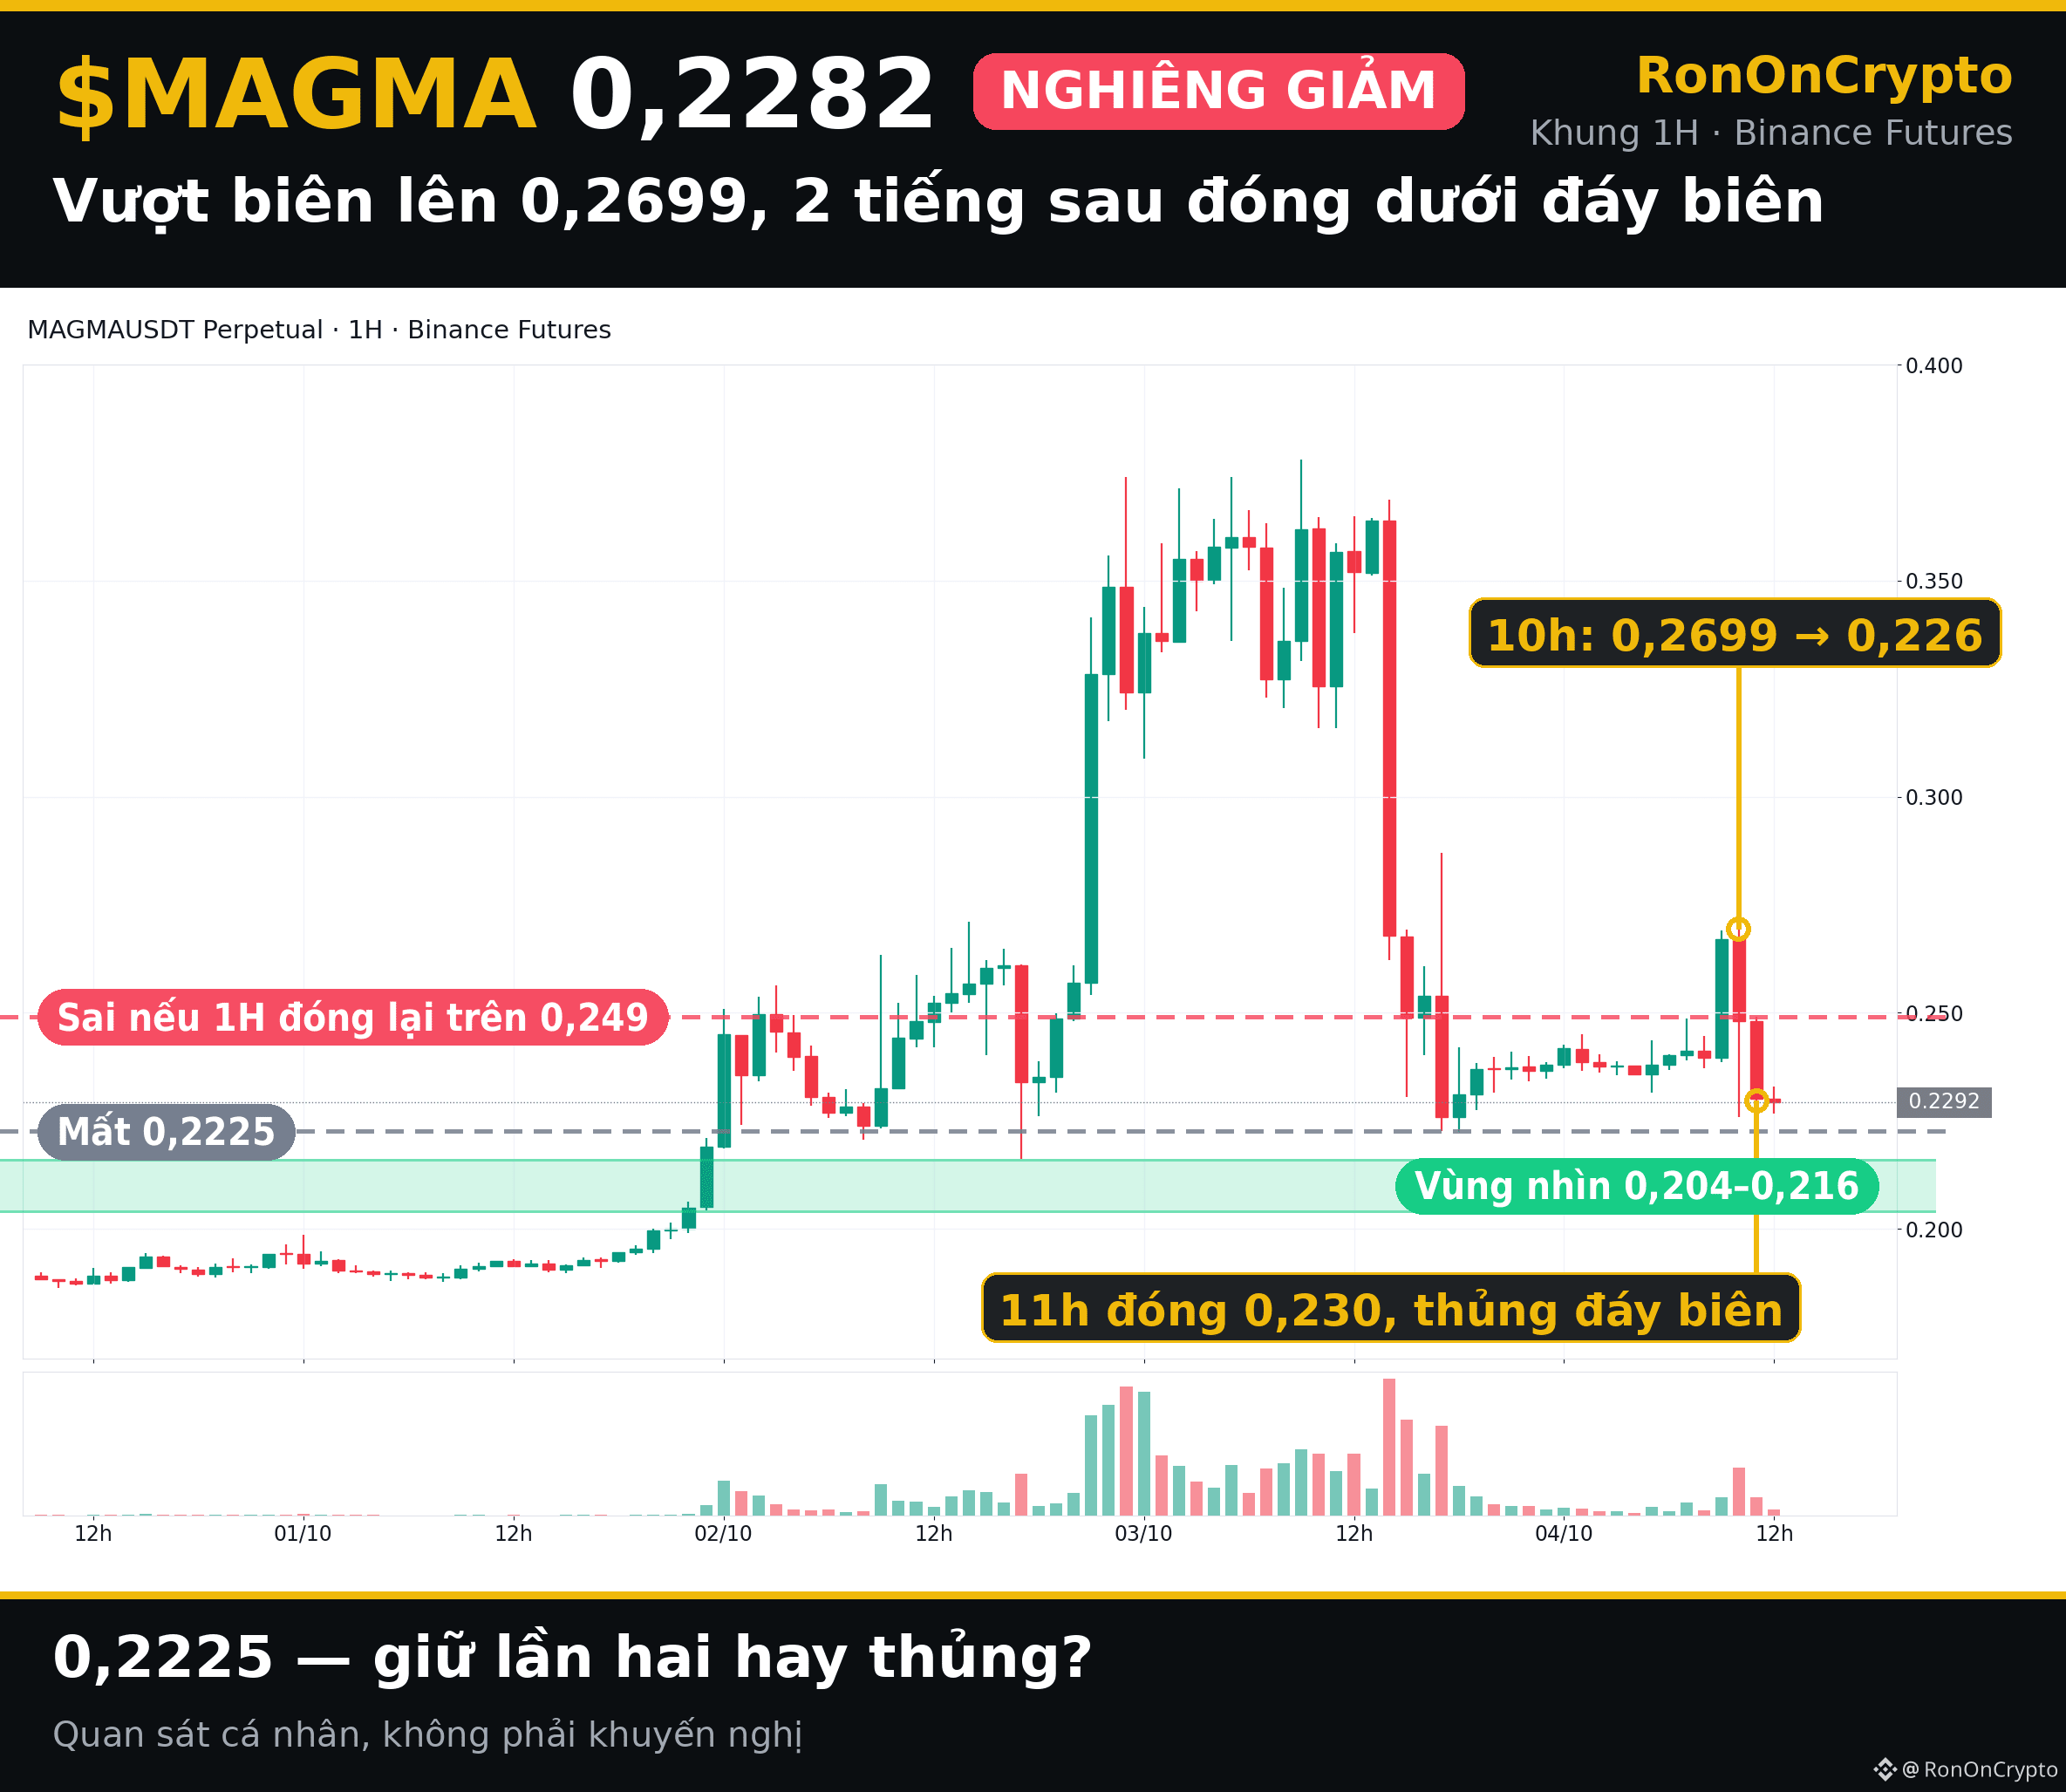
$MAGMA 0,2282 — 9 a.m. breached the boundary, moving up to 0.267; two hours later it closed below the lower boundary.
1H chart: the boundary breach failed; price turned back to hover near the previous session’s lower boundary at 0.2225.
From 8 p.m. last night, price got stuck in the 0.231–0.249 range. At 10 a.m. the candle touched 0.2699—just short of the top of the consolidation zone at 0.271 from Oct 2—then it fell to 0.226 within that same candle. The 11 a.m. candle closed at 0.230, breaking through the lower boundary. Open interest has pulled back from 10.3 to 6.3 million USD since the Oct 3 peak, while nearly 2/3 of accounts are still long.
Breaking the boundary and then being pushed back in the opposite direction is a sign that the long side is getting exhausted. Bearish tilt: if 0.2225 is lost, then the visible zone is 0.204–0.216, the low from Oct 2, and the tail wick from the candle late on Oct 1. It’s invalid if the 1H candle closes back above 0.249.
0.2225 — hold for the second time or break through?
Personal observation only, not financial advice. 1% risk—there is always a stop point.
#MAGMA $MAGMA
1H chart: the boundary breach failed; price turned back to hover near the previous session’s lower boundary at 0.2225.
From 8 p.m. last night, price got stuck in the 0.231–0.249 range. At 10 a.m. the candle touched 0.2699—just short of the top of the consolidation zone at 0.271 from Oct 2—then it fell to 0.226 within that same candle. The 11 a.m. candle closed at 0.230, breaking through the lower boundary. Open interest has pulled back from 10.3 to 6.3 million USD since the Oct 3 peak, while nearly 2/3 of accounts are still long.
Breaking the boundary and then being pushed back in the opposite direction is a sign that the long side is getting exhausted. Bearish tilt: if 0.2225 is lost, then the visible zone is 0.204–0.216, the low from Oct 2, and the tail wick from the candle late on Oct 1. It’s invalid if the 1H candle closes back above 0.249.
0.2225 — hold for the second time or break through?
Personal observation only, not financial advice. 1% risk—there is always a stop point.
#MAGMA $MAGMA