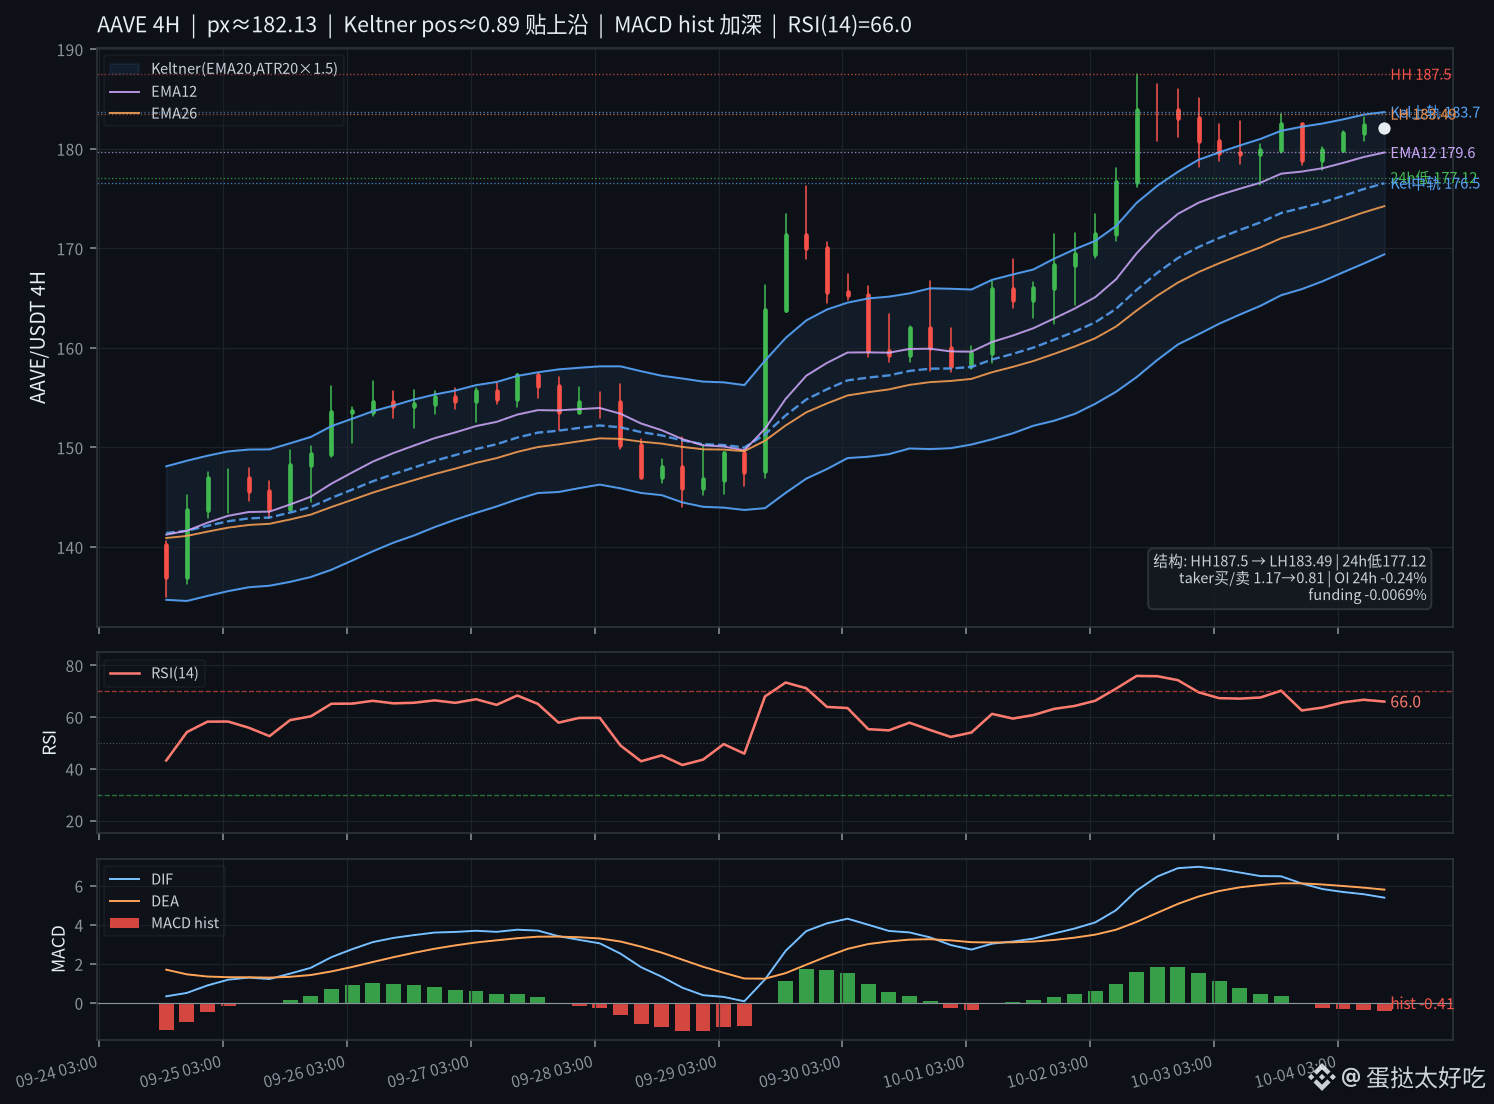
$AAVE is sticking to the Keltner upper band while the momentum bars keep digging five negative ones—this weekend’s rally looks more like “continuation fuel,” but more like a turnover along the upper rail.
Current price is around 182.1, 24h +2.4% (high 183.49 / low 177.12, volume about 19.9M U). On 4H Keltner (EMA20, ATR20×1.5), the midline is 176.55 / upper 183.70 / lower 169.40. ATR20≈4.77. Channel position is 0.89, basically pressing right against the upper band. RSI(14) on 4H=66.0 (1H=57.3): a bit overheated but not overbought. MACD(12,26,9): DIF=+5.39 / DEA=+5.80 / hist=-0.41. The bars have been dug down from the prior six or seven bars at +0.76 to -0.41; DIF is still positive, but it has already fallen below the DEA.
Structurally: after HH 187.5, it formed an LH 183.49 (overlapping today’s high / the upper-band zone). Below that, first watch EMA12 at 179.6, then 24h low 177.12 / Keltner midline 176.5. Invalidated if: a 4H close breaks below 177.12 would lift and interrupt this. If the label truly needs to change, at least it must hold above 183.7 and push a bit more toward 187.5.
On the contract side: OI over 24h is about -0.24%—almost no new positioning. The buyer/seller ratio flipped from 1.17 on the previous candle to 0.81, leaning more toward sells. Global long/short accounts ratio is 1.60 (about 62% longs). TopPos is 1.89. Funding rate is -0.0069%; leverage isn’t chasing a breakout premium.
A green candle clinging to the upper band, RSI somewhat hot, MACD histogram deepening, taker flipping toward sells, and the structure already printing an LH—all two interpretations can coexist. I’ll treat 183.7 / 177.1 as the up/down “trial stones” first, and I won’t treat sticking to the upper band as a confirmed breakout.
#AAVE #技术分析 #contract data
Current price is around 182.1, 24h +2.4% (high 183.49 / low 177.12, volume about 19.9M U). On 4H Keltner (EMA20, ATR20×1.5), the midline is 176.55 / upper 183.70 / lower 169.40. ATR20≈4.77. Channel position is 0.89, basically pressing right against the upper band. RSI(14) on 4H=66.0 (1H=57.3): a bit overheated but not overbought. MACD(12,26,9): DIF=+5.39 / DEA=+5.80 / hist=-0.41. The bars have been dug down from the prior six or seven bars at +0.76 to -0.41; DIF is still positive, but it has already fallen below the DEA.
Structurally: after HH 187.5, it formed an LH 183.49 (overlapping today’s high / the upper-band zone). Below that, first watch EMA12 at 179.6, then 24h low 177.12 / Keltner midline 176.5. Invalidated if: a 4H close breaks below 177.12 would lift and interrupt this. If the label truly needs to change, at least it must hold above 183.7 and push a bit more toward 187.5.
On the contract side: OI over 24h is about -0.24%—almost no new positioning. The buyer/seller ratio flipped from 1.17 on the previous candle to 0.81, leaning more toward sells. Global long/short accounts ratio is 1.60 (about 62% longs). TopPos is 1.89. Funding rate is -0.0069%; leverage isn’t chasing a breakout premium.
A green candle clinging to the upper band, RSI somewhat hot, MACD histogram deepening, taker flipping toward sells, and the structure already printing an LH—all two interpretations can coexist. I’ll treat 183.7 / 177.1 as the up/down “trial stones” first, and I won’t treat sticking to the upper band as a confirmed breakout.
#AAVE #技术分析 #contract data