$ZEC
Has the correction finished, or is it still ongoing?
By combining the hourly + daily + weekly timeframes, the picture has become clearer:
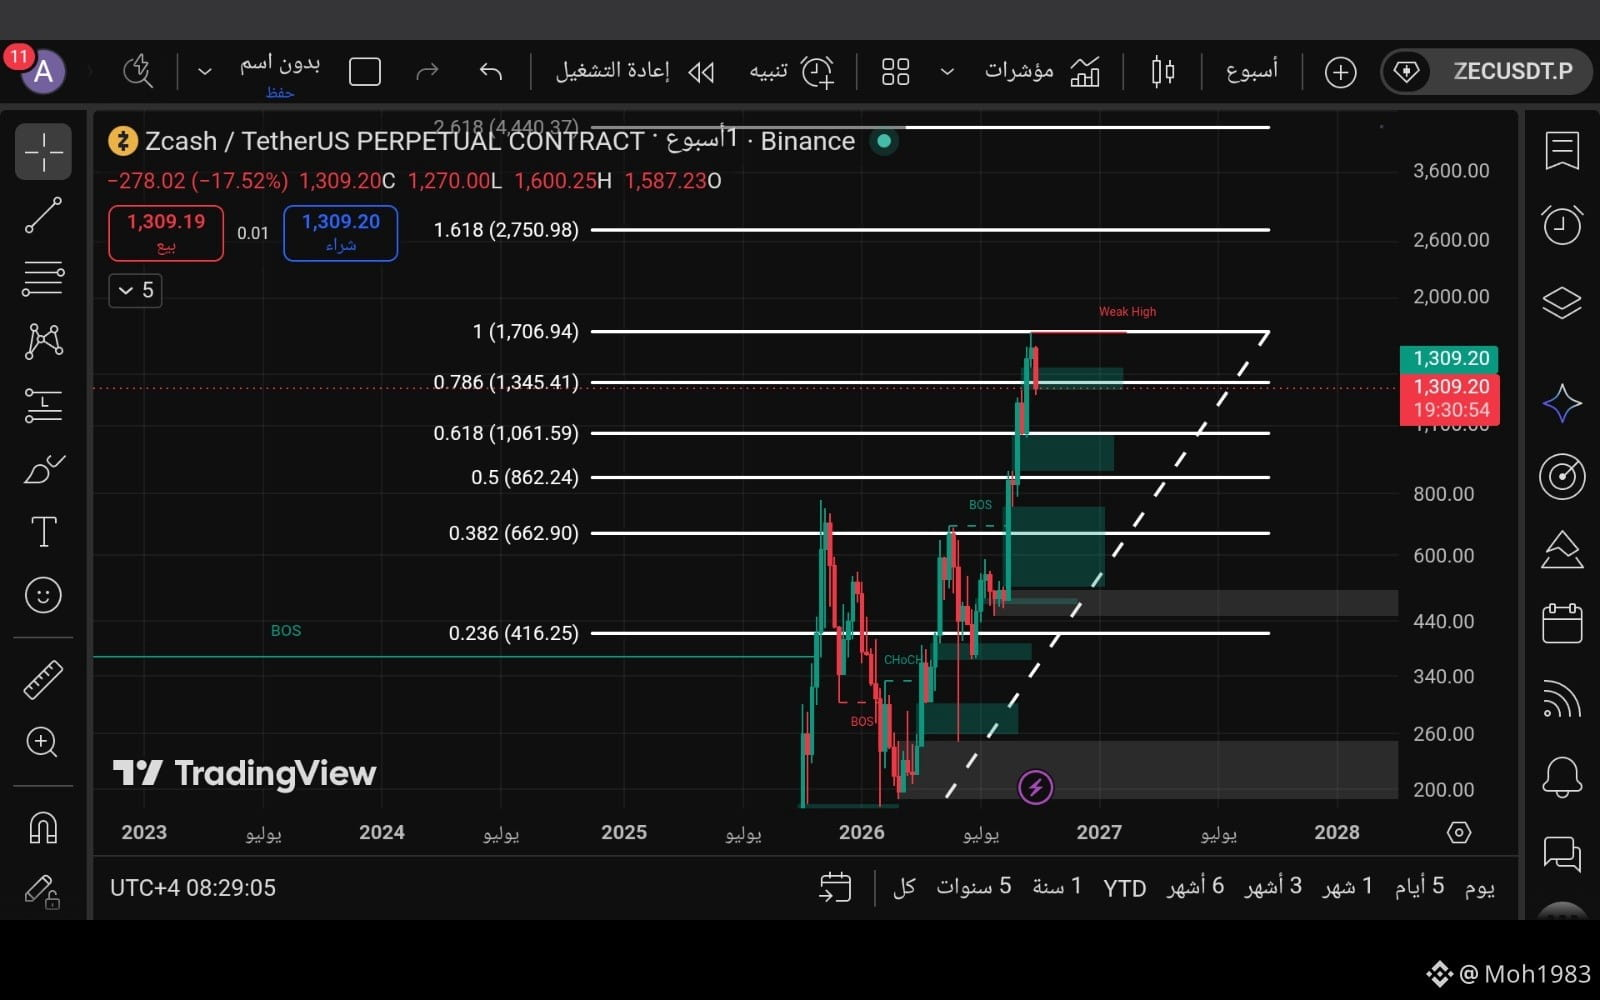
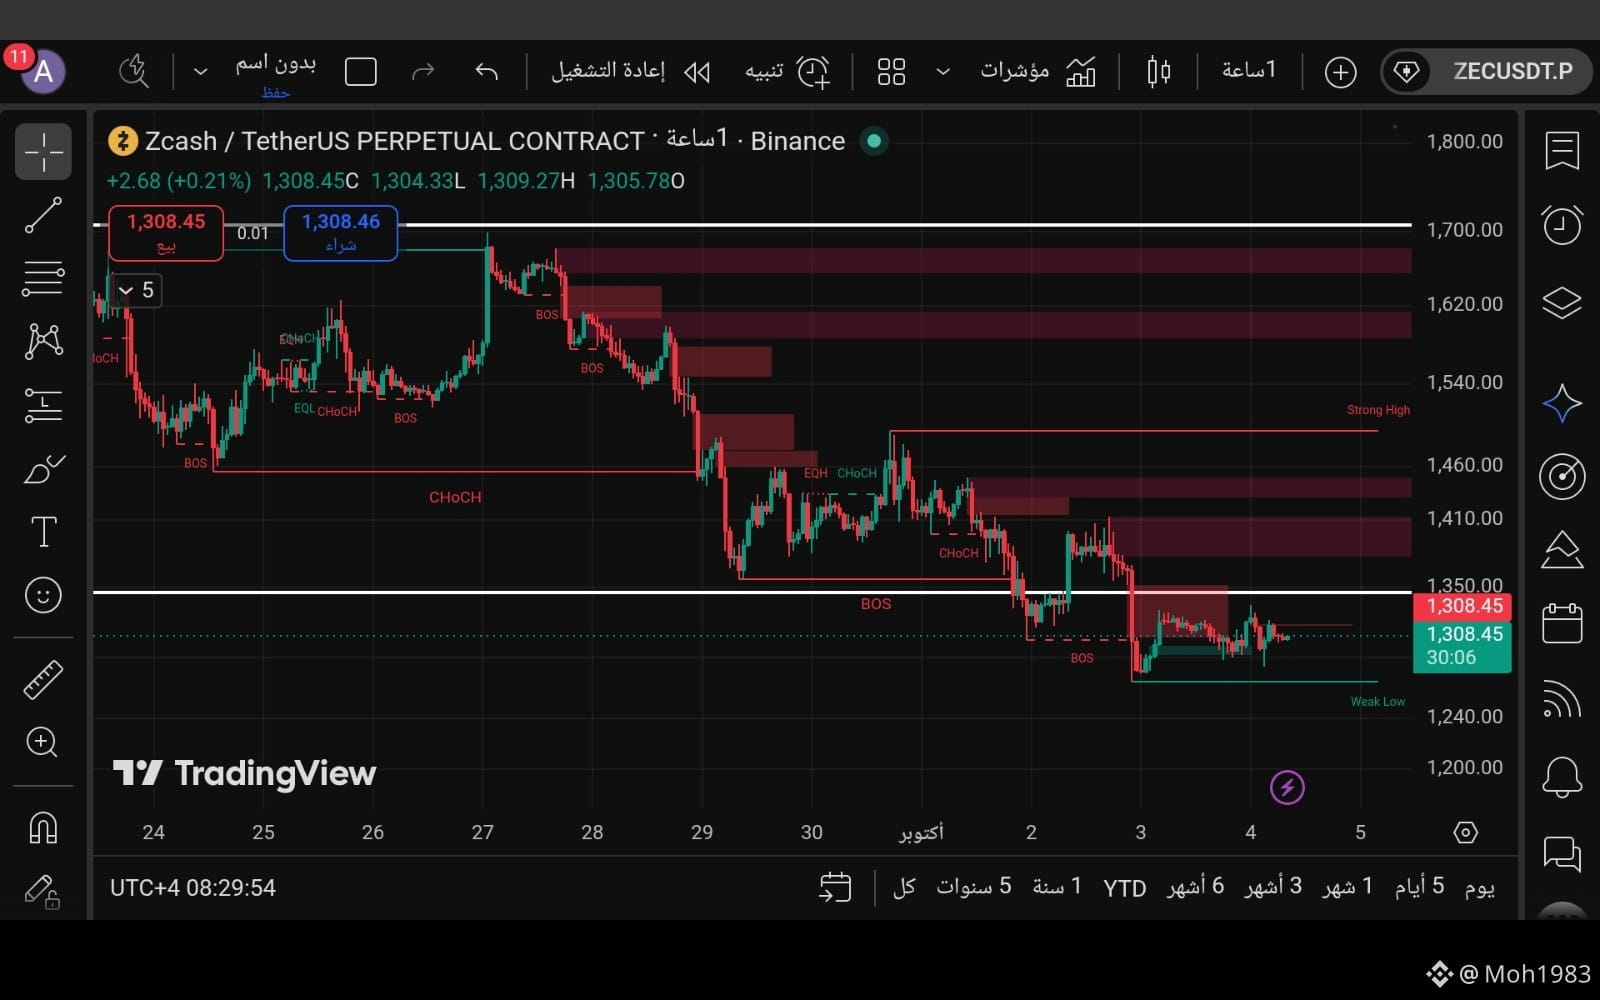
On the hourly timeframe, the trend is still bearish, and the price is moving below important resistance zones. However, on the daily and weekly timeframes, the current move still looks closer to a correction within the larger bullish trend, after the strong wave that pushed ZEC from areas around 400 to the peak near 1700.
🟢 Scenario 1 — Continued Upside
If the price holds the 1240–1270 zone and a rebound appears from there, then if it can reclaim 1345–1382 and stay above it, that would be a good sign of renewed strength.
🎯 1410
🎯 1460
🎯 1490–1520
And once 1520 is broken, targeting the previous high near 1690–1700 becomes likely.
🔴 Scenario 2 — Deeper Correction
If the price fails to reclaim 1345–1382 and then clearly breaks 1240, then I wouldn’t recommend chasing a buy, because the correction may extend toward:
📍 1140–1100 ← a stronger support area to continue monitoring and look for a rebound.
🛒 Best Buy and Follow-Up Zones
1260–1290 → Buy only if a clear rebound appears.
1140–1180 → Stronger zone in case of a deeper correction.
1345–1382 → Confirmation buy after reclaiming the zone and holding above it.
Summary:
The hourly timeframe is still bearish, but the bigger picture has not been broken yet. Therefore, it’s best not to chase the price around 1308 and instead wait for confirmation from support or a reclaim of 1345–1382.
⚠️ This analysis is educational and not financial advice.
Has the correction finished, or is it still ongoing?
By combining the hourly + daily + weekly timeframes, the picture has become clearer:
On the hourly timeframe, the trend is still bearish, and the price is moving below important resistance zones. However, on the daily and weekly timeframes, the current move still looks closer to a correction within the larger bullish trend, after the strong wave that pushed ZEC from areas around 400 to the peak near 1700.
🟢 Scenario 1 — Continued Upside
If the price holds the 1240–1270 zone and a rebound appears from there, then if it can reclaim 1345–1382 and stay above it, that would be a good sign of renewed strength.
🎯 1410
🎯 1460
🎯 1490–1520
And once 1520 is broken, targeting the previous high near 1690–1700 becomes likely.
🔴 Scenario 2 — Deeper Correction
If the price fails to reclaim 1345–1382 and then clearly breaks 1240, then I wouldn’t recommend chasing a buy, because the correction may extend toward:
📍 1140–1100 ← a stronger support area to continue monitoring and look for a rebound.
🛒 Best Buy and Follow-Up Zones
1260–1290 → Buy only if a clear rebound appears.
1140–1180 → Stronger zone in case of a deeper correction.
1345–1382 → Confirmation buy after reclaiming the zone and holding above it.
Summary:
The hourly timeframe is still bearish, but the bigger picture has not been broken yet. Therefore, it’s best not to chase the price around 1308 and instead wait for confirmation from support or a reclaim of 1345–1382.
⚠️ This analysis is educational and not financial advice.