$AIN
📊 Breakdown of the AIN/USDT chart: a technical view with 2 scenarios and specific targets
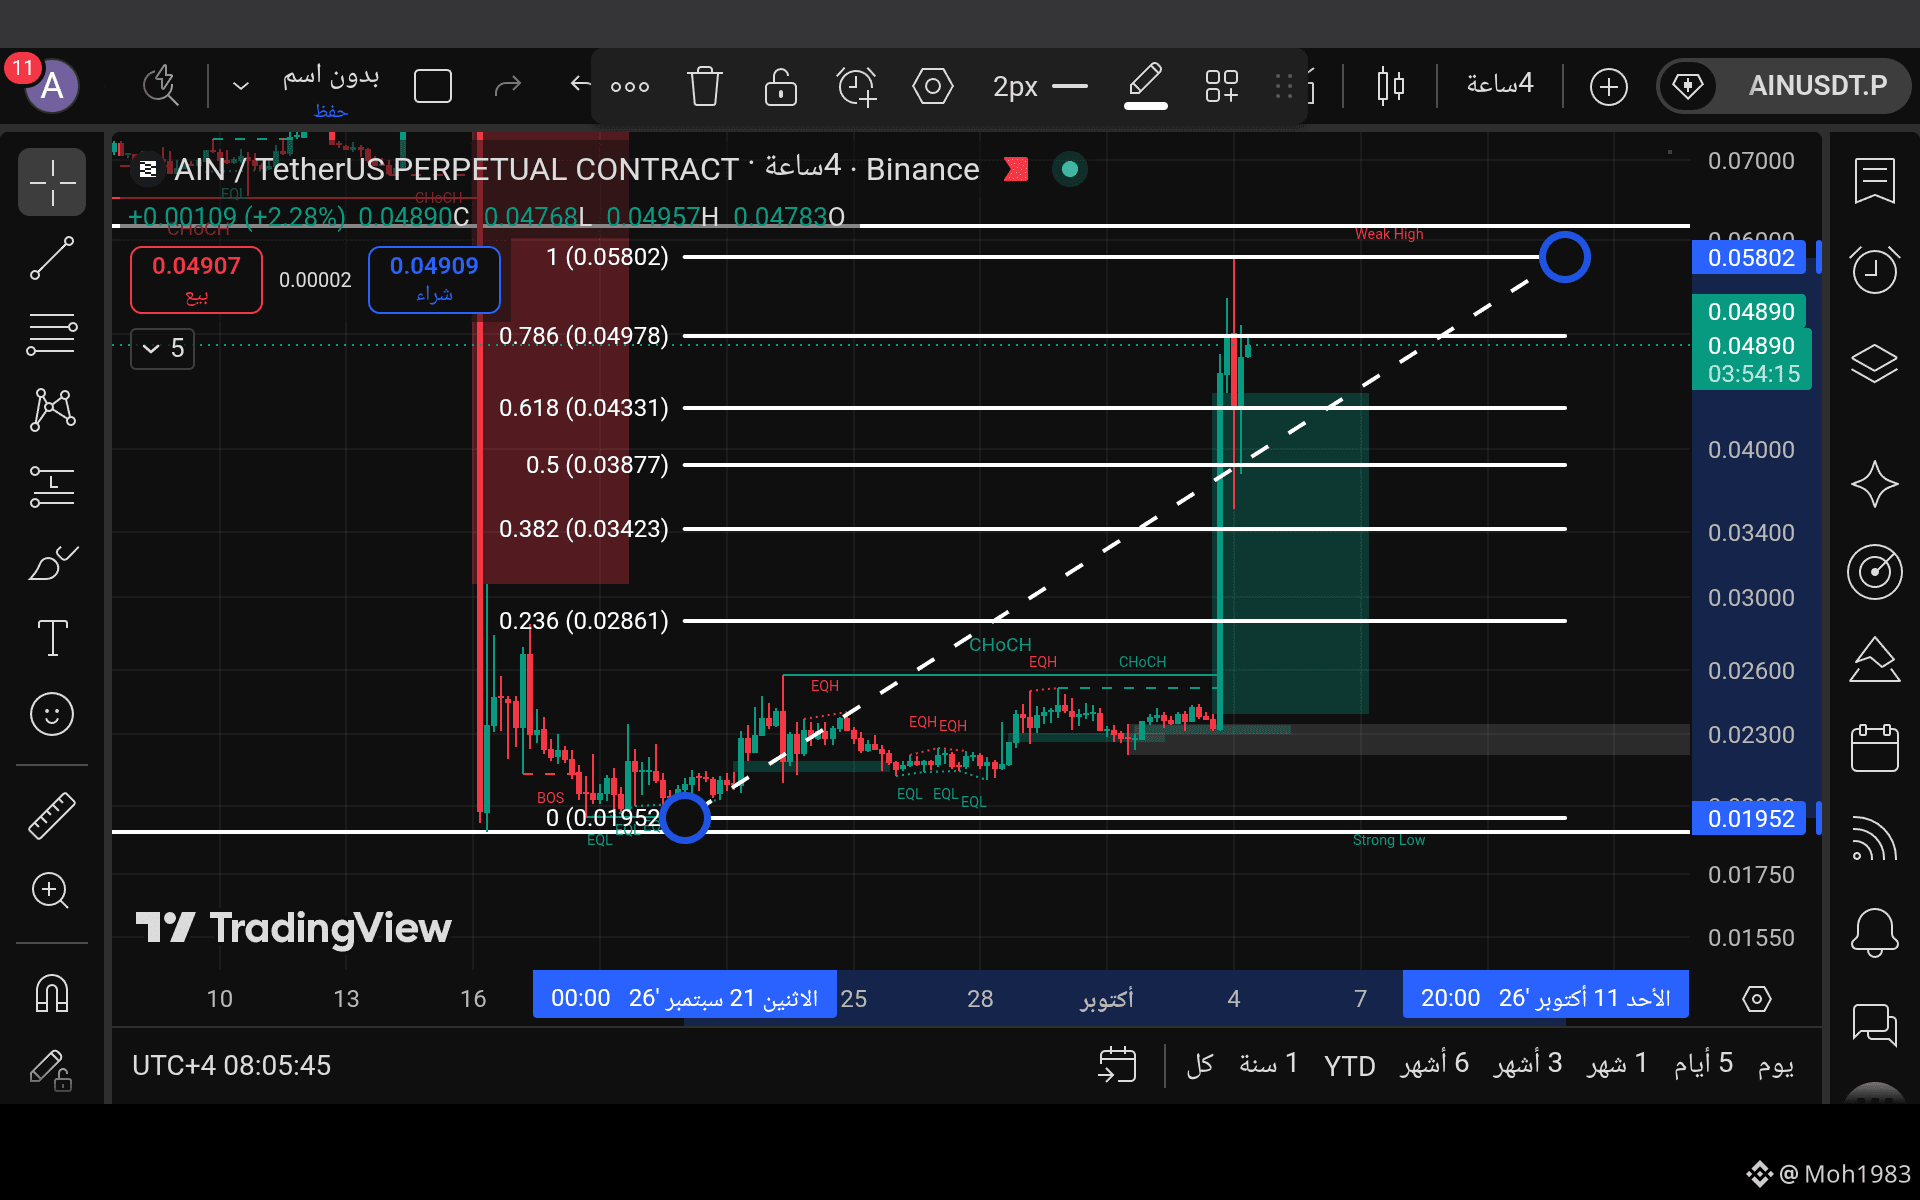
After the strong rally the coin witnessed and the move from its historical low up to current levels, the price is now going through a phase of quiet consolidation and reorganization. Let’s break down the next move simply:
🎯 The most important levels on the chart:
* Buy zones and consolidation:
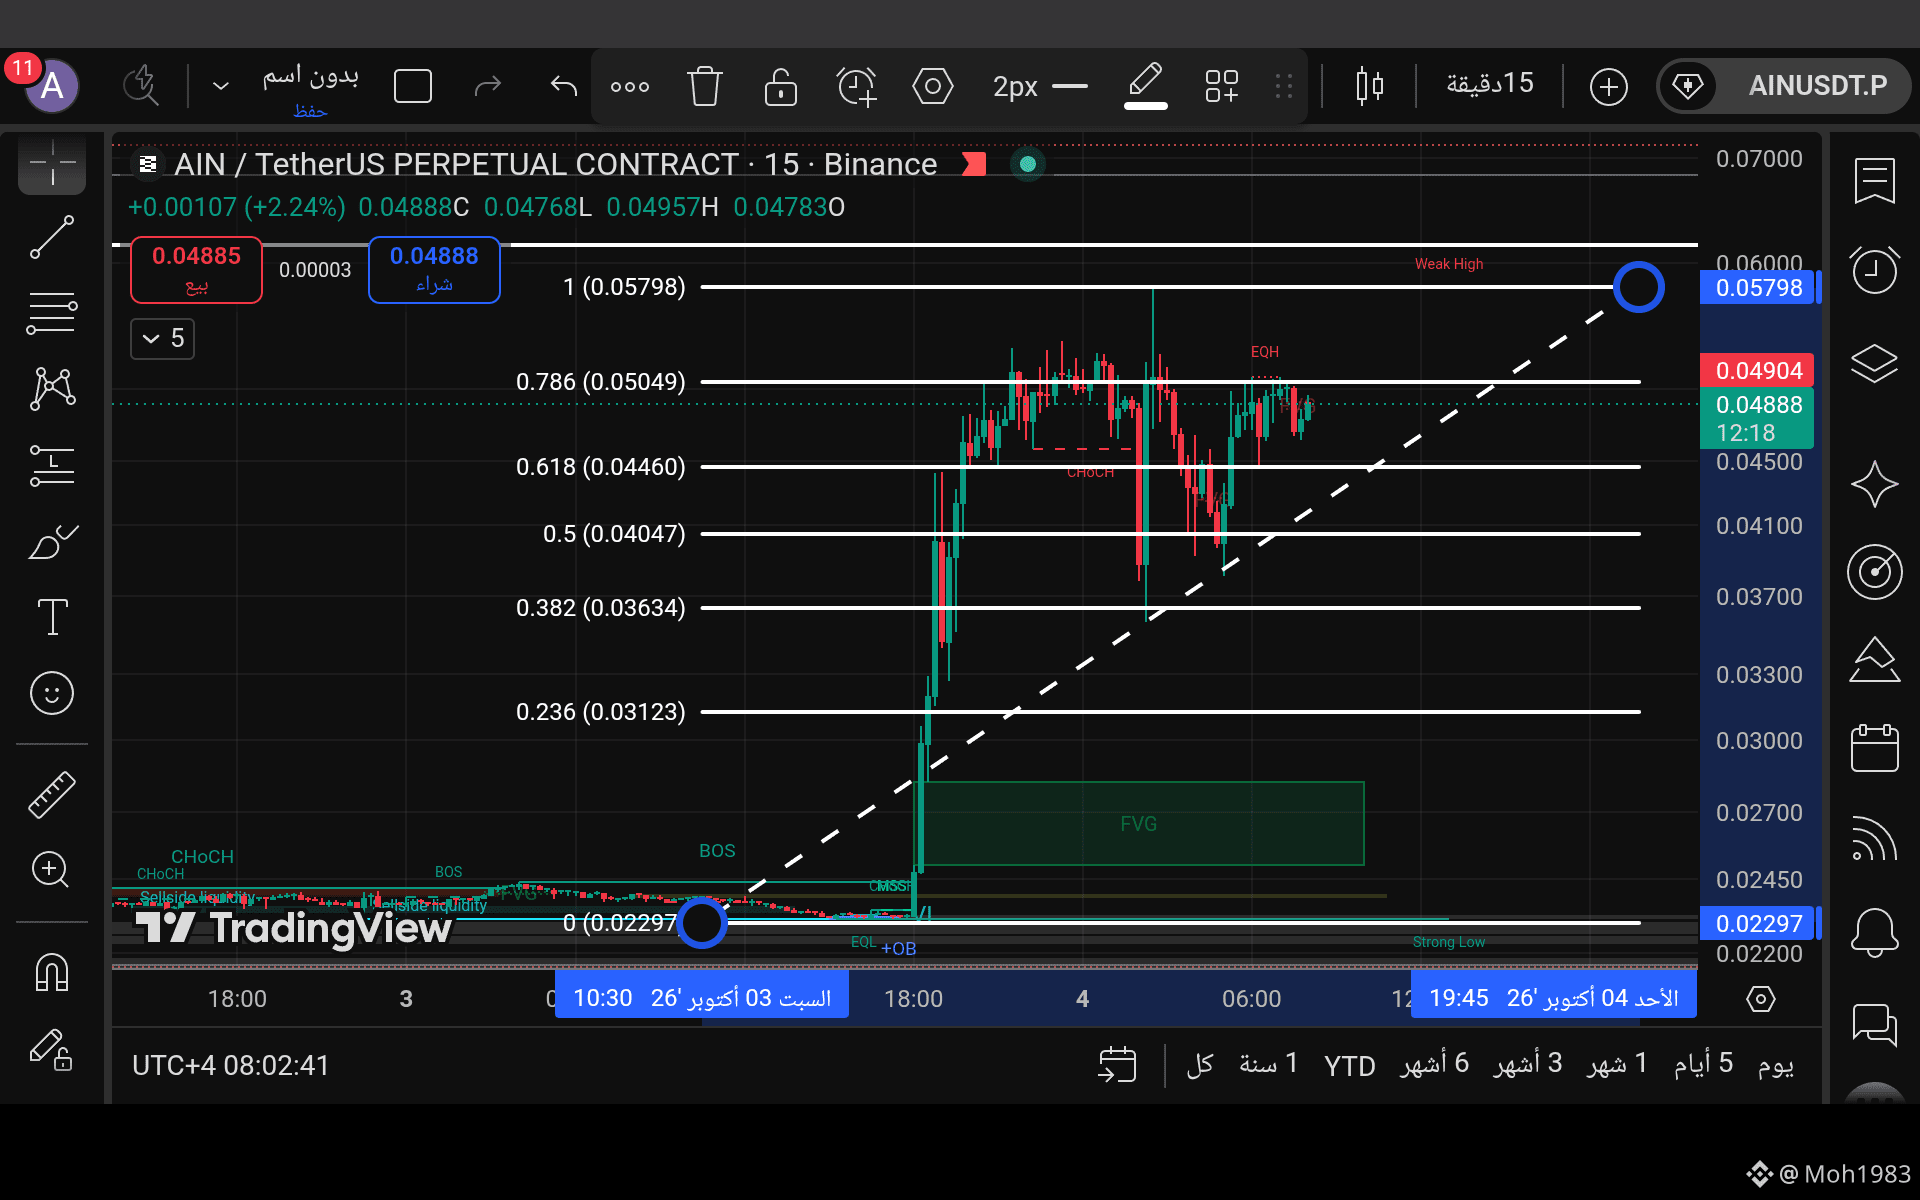
* First zone (mild correction): at 0.0446 levels
* Golden zone (strong support): between 0.0387 - 0.0404 (important technical support levels).
* Stop-loss: breaking the main support level and closing the candle below it invalidates the bullish scenario.
🔄 Scenario 1 (Bullish - higher probability):
Price stabilizing and holding above the current support zones sets the stage for a gradual upward move toward the following targets:
* 🎯 Target 1: 0.0504
* 🎯 Target 2: 0.0579
* 🎯 Target 3 (last): 0.0610
⚠️ Scenario 2 (deeper correction):
If selling pressure increases and the first support zones are broken, the price may head toward a retest of the lower areas to gather new liquidity before thinking about any upcoming bullish move.
💡 Risk management tip:
The decision is always yours—study the chart with your own eyes, split your entries into parts at the support zones, and strictly adhere to a stop-loss to protect your capital!
$AIN
📊 Breakdown of the AIN/USDT chart: a technical view with 2 scenarios and specific targets
After the strong rally the coin witnessed and the move from its historical low up to current levels, the price is now going through a phase of quiet consolidation and reorganization. Let’s break down the next move simply:
🎯 The most important levels on the chart:
* Buy zones and consolidation:
* First zone (mild correction): at 0.0446 levels
* Golden zone (strong support): between 0.0387 - 0.0404 (important technical support levels).
* Stop-loss: breaking the main support level and closing the candle below it invalidates the bullish scenario.
🔄 Scenario 1 (Bullish - higher probability):
Price stabilizing and holding above the current support zones sets the stage for a gradual upward move toward the following targets:
* 🎯 Target 1: 0.0504
* 🎯 Target 2: 0.0579
* 🎯 Target 3 (last): 0.0610
⚠️ Scenario 2 (deeper correction):
If selling pressure increases and the first support zones are broken, the price may head toward a retest of the lower areas to gather new liquidity before thinking about any upcoming bullish move.
💡 Risk management tip:
The decision is always yours—study the chart with your own eyes, split your entries into parts at the support zones, and strictly adhere to a stop-loss to protect your capital!
$AIN