🚨 ATTENTION CRYPTO INVESTORS: ALTSEASON 3.0 IS LOADING 🚨
If you’ve been waiting for the biggest capital rotation in crypto history, the macro monthly chart for Bitcoin Dominance ($BTC.D) is flashing a signal that can not be ignored.
📉 The Chart Breakdown: History Doesn't Repeat, But It Rhymes
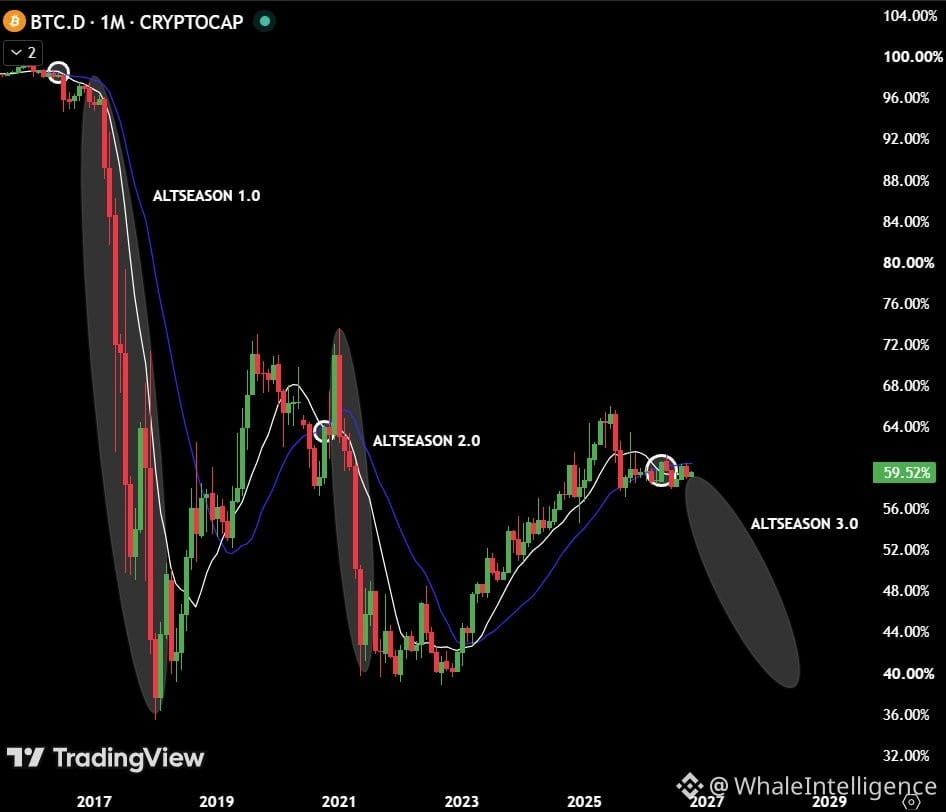
Looking at the multi-year 1-Month BTC.D TradingView chart, we are seeing a textbook setup unfolding right before our eyes:
Altseason 1.0 (2017–2018): $BTC.D rejected hard near ~99% down to 36%, unleashing the infamous initial altcoin explosion.
Altseason 2.0 (2020–2021): After a multi-year consolidation, moving averages crossed over in the 70% region, triggering a vertical drop in Bitcoin dominance down to ~39% and kicking off a mega altcoin bull run.
Altseason 3.0 (2026–2027 Macro Target): $BTC.D peaked in the ~64% zone and is now sitting around 59.5%. It is currently testing a crucial moving average death cross on the monthly timeframe, mirroring the exact top structures from previous cycles.
💡 Why the Next Few Years Could Be Massive for Alts
The Moving Average Confirmation: Whenever the faster white moving average crosses below the blue trendline on the monthly chart, Bitcoin loses market share rapidly as institutional and retail profits rotate down the risk curve.
Rejection at Key Resistance: $BTC.D has repeatedly failed to push beyond the 60%–64% ceiling. As Bitcoin consolidates near cycle highs, capital naturally seeks out higher-beta opportunities across top Layer 1s, DeFi, AI, and ecosystem tokens.
Liquidity Inflow: A 5%–10% breakdown in Bitcoin dominance represents hundreds of billions of dollars flooding into altcoins, creating massive asymmetrical upside potential across broad market categories.
🎯 Key Takeaway for Crypto Investors
Patience in macro consolidation is where fortunes are built. While Bitcoin paves the way during the early stages of a bull market, Altseason 3.0 represents the secondary wave where real market outperformance happens.
#altcoins #crypto #CryptoNews🚀🔥 #BTC #altcoinseason
If you’ve been waiting for the biggest capital rotation in crypto history, the macro monthly chart for Bitcoin Dominance ($BTC.D) is flashing a signal that can not be ignored.
📉 The Chart Breakdown: History Doesn't Repeat, But It Rhymes
Looking at the multi-year 1-Month BTC.D TradingView chart, we are seeing a textbook setup unfolding right before our eyes:
Altseason 1.0 (2017–2018): $BTC.D rejected hard near ~99% down to 36%, unleashing the infamous initial altcoin explosion.
Altseason 2.0 (2020–2021): After a multi-year consolidation, moving averages crossed over in the 70% region, triggering a vertical drop in Bitcoin dominance down to ~39% and kicking off a mega altcoin bull run.
Altseason 3.0 (2026–2027 Macro Target): $BTC.D peaked in the ~64% zone and is now sitting around 59.5%. It is currently testing a crucial moving average death cross on the monthly timeframe, mirroring the exact top structures from previous cycles.
💡 Why the Next Few Years Could Be Massive for Alts
The Moving Average Confirmation: Whenever the faster white moving average crosses below the blue trendline on the monthly chart, Bitcoin loses market share rapidly as institutional and retail profits rotate down the risk curve.
Rejection at Key Resistance: $BTC.D has repeatedly failed to push beyond the 60%–64% ceiling. As Bitcoin consolidates near cycle highs, capital naturally seeks out higher-beta opportunities across top Layer 1s, DeFi, AI, and ecosystem tokens.
Liquidity Inflow: A 5%–10% breakdown in Bitcoin dominance represents hundreds of billions of dollars flooding into altcoins, creating massive asymmetrical upside potential across broad market categories.
🎯 Key Takeaway for Crypto Investors
Patience in macro consolidation is where fortunes are built. While Bitcoin paves the way during the early stages of a bull market, Altseason 3.0 represents the secondary wave where real market outperformance happens.
#altcoins #crypto #CryptoNews🚀🔥 #BTC #altcoinseason