Technical Analysis: $AIN /USDT Perpetual (1D)
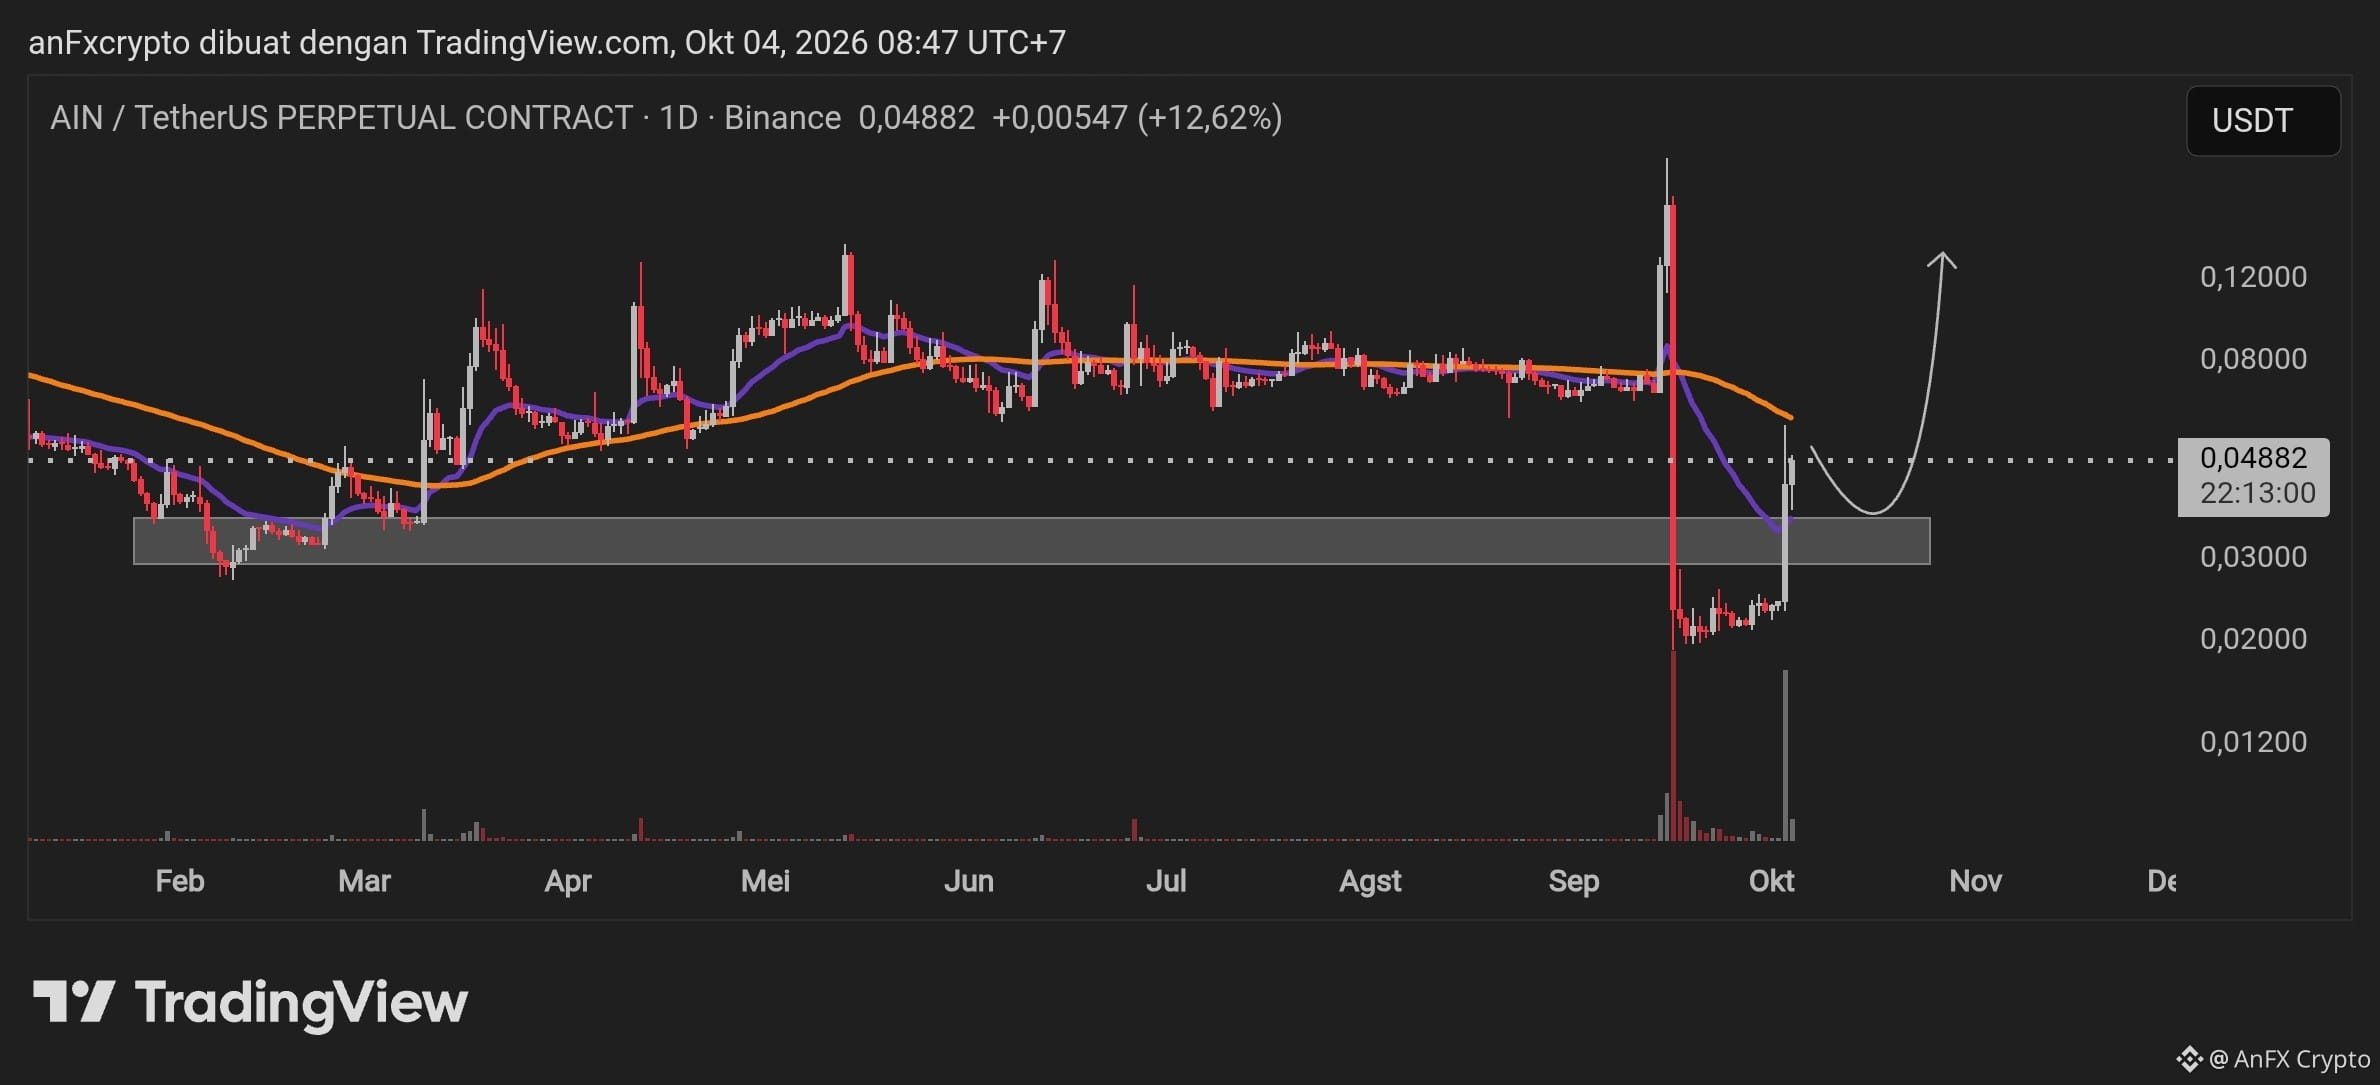
The AIN/USDT market shows a reversal in direction (trend reversal) after experiencing a sharp drop (flash crash) toward the lowest area of $0.01200 – $0.02000.
Market Structure & Price Action: After a long consolidation phase in the range of $0.02000, a buy impulse pushed the price up significantly, breaking through $0.04882 (+12.62%). This move confirms strong accumulation volume.
Key Support & Resistance Levels:
Main Support (Demand Zone): $0.03000 – $0.03500 (previously a local resistance that is now confirmed as support).
Dynamic Resistance: Long-term Moving Average (orange line) in the area of $0.06800 – $0.07000.
Main Resistance: $0.09500 and $0.12000 (upside targets according to the wave projection on the chart).
Indicators: The short-term Moving Average (purple line) is starting to curve upward (bullish crossover setup), indicating bullish momentum for the medium term.
Trading Signal (Trading Plan)
The best scenario is to wait for confirmation of a pullback / retest to the support area before opening a long position (Buy on Dip).
ParameterPrice Level / DescriptionPosition DirectionLONG / BUYEntry Zone$0.03100 – $0.03600 (Wait for a retest of the support area)Take Profit 1 (TP 1)$0.06800 (MA Resistance & Conservative Target)Take Profit 2 (TP 2)$0.09500 (Mid-term Supply Area)Take Profit 3 (TP 3)$0.12000 (Main Projection Target)Stop Loss (SL)$0.02400 (Below the nearest support structure)Risk / Reward Ratio1 : 3.5+
Risk Management & Execution Strategy
Leverage & Position Sizing: Use low leverage (2x – 5x) on the Perpetual Contract, considering this asset has a history of high volatility and extreme price wicks. Limit maximum risk to 1–2% of total portfolio equity.
Entry Validation: If price breaks below $0.03000 with a daily candle close, cancel the long scenario and wait for a new market structure to form.
The AIN/USDT market shows a reversal in direction (trend reversal) after experiencing a sharp drop (flash crash) toward the lowest area of $0.01200 – $0.02000.
Market Structure & Price Action: After a long consolidation phase in the range of $0.02000, a buy impulse pushed the price up significantly, breaking through $0.04882 (+12.62%). This move confirms strong accumulation volume.
Key Support & Resistance Levels:
Main Support (Demand Zone): $0.03000 – $0.03500 (previously a local resistance that is now confirmed as support).
Dynamic Resistance: Long-term Moving Average (orange line) in the area of $0.06800 – $0.07000.
Main Resistance: $0.09500 and $0.12000 (upside targets according to the wave projection on the chart).
Indicators: The short-term Moving Average (purple line) is starting to curve upward (bullish crossover setup), indicating bullish momentum for the medium term.
Trading Signal (Trading Plan)
The best scenario is to wait for confirmation of a pullback / retest to the support area before opening a long position (Buy on Dip).
ParameterPrice Level / DescriptionPosition DirectionLONG / BUYEntry Zone$0.03100 – $0.03600 (Wait for a retest of the support area)Take Profit 1 (TP 1)$0.06800 (MA Resistance & Conservative Target)Take Profit 2 (TP 2)$0.09500 (Mid-term Supply Area)Take Profit 3 (TP 3)$0.12000 (Main Projection Target)Stop Loss (SL)$0.02400 (Below the nearest support structure)Risk / Reward Ratio1 : 3.5+
Risk Management & Execution Strategy
Leverage & Position Sizing: Use low leverage (2x – 5x) on the Perpetual Contract, considering this asset has a history of high volatility and extreme price wicks. Limit maximum risk to 1–2% of total portfolio equity.
Entry Validation: If price breaks below $0.03000 with a daily candle close, cancel the long scenario and wait for a new market structure to form.