
@
🔥 Bitcoin in the breakout zone | 87,648: breakout gate or the beginning of structural unraveling
Let’s dissect Bitcoin again, linking the short- and long-term paths, so we know where the uptrend continues, where the structure starts to break down, and when the correction turns into a downward move and a change in the overall direction.
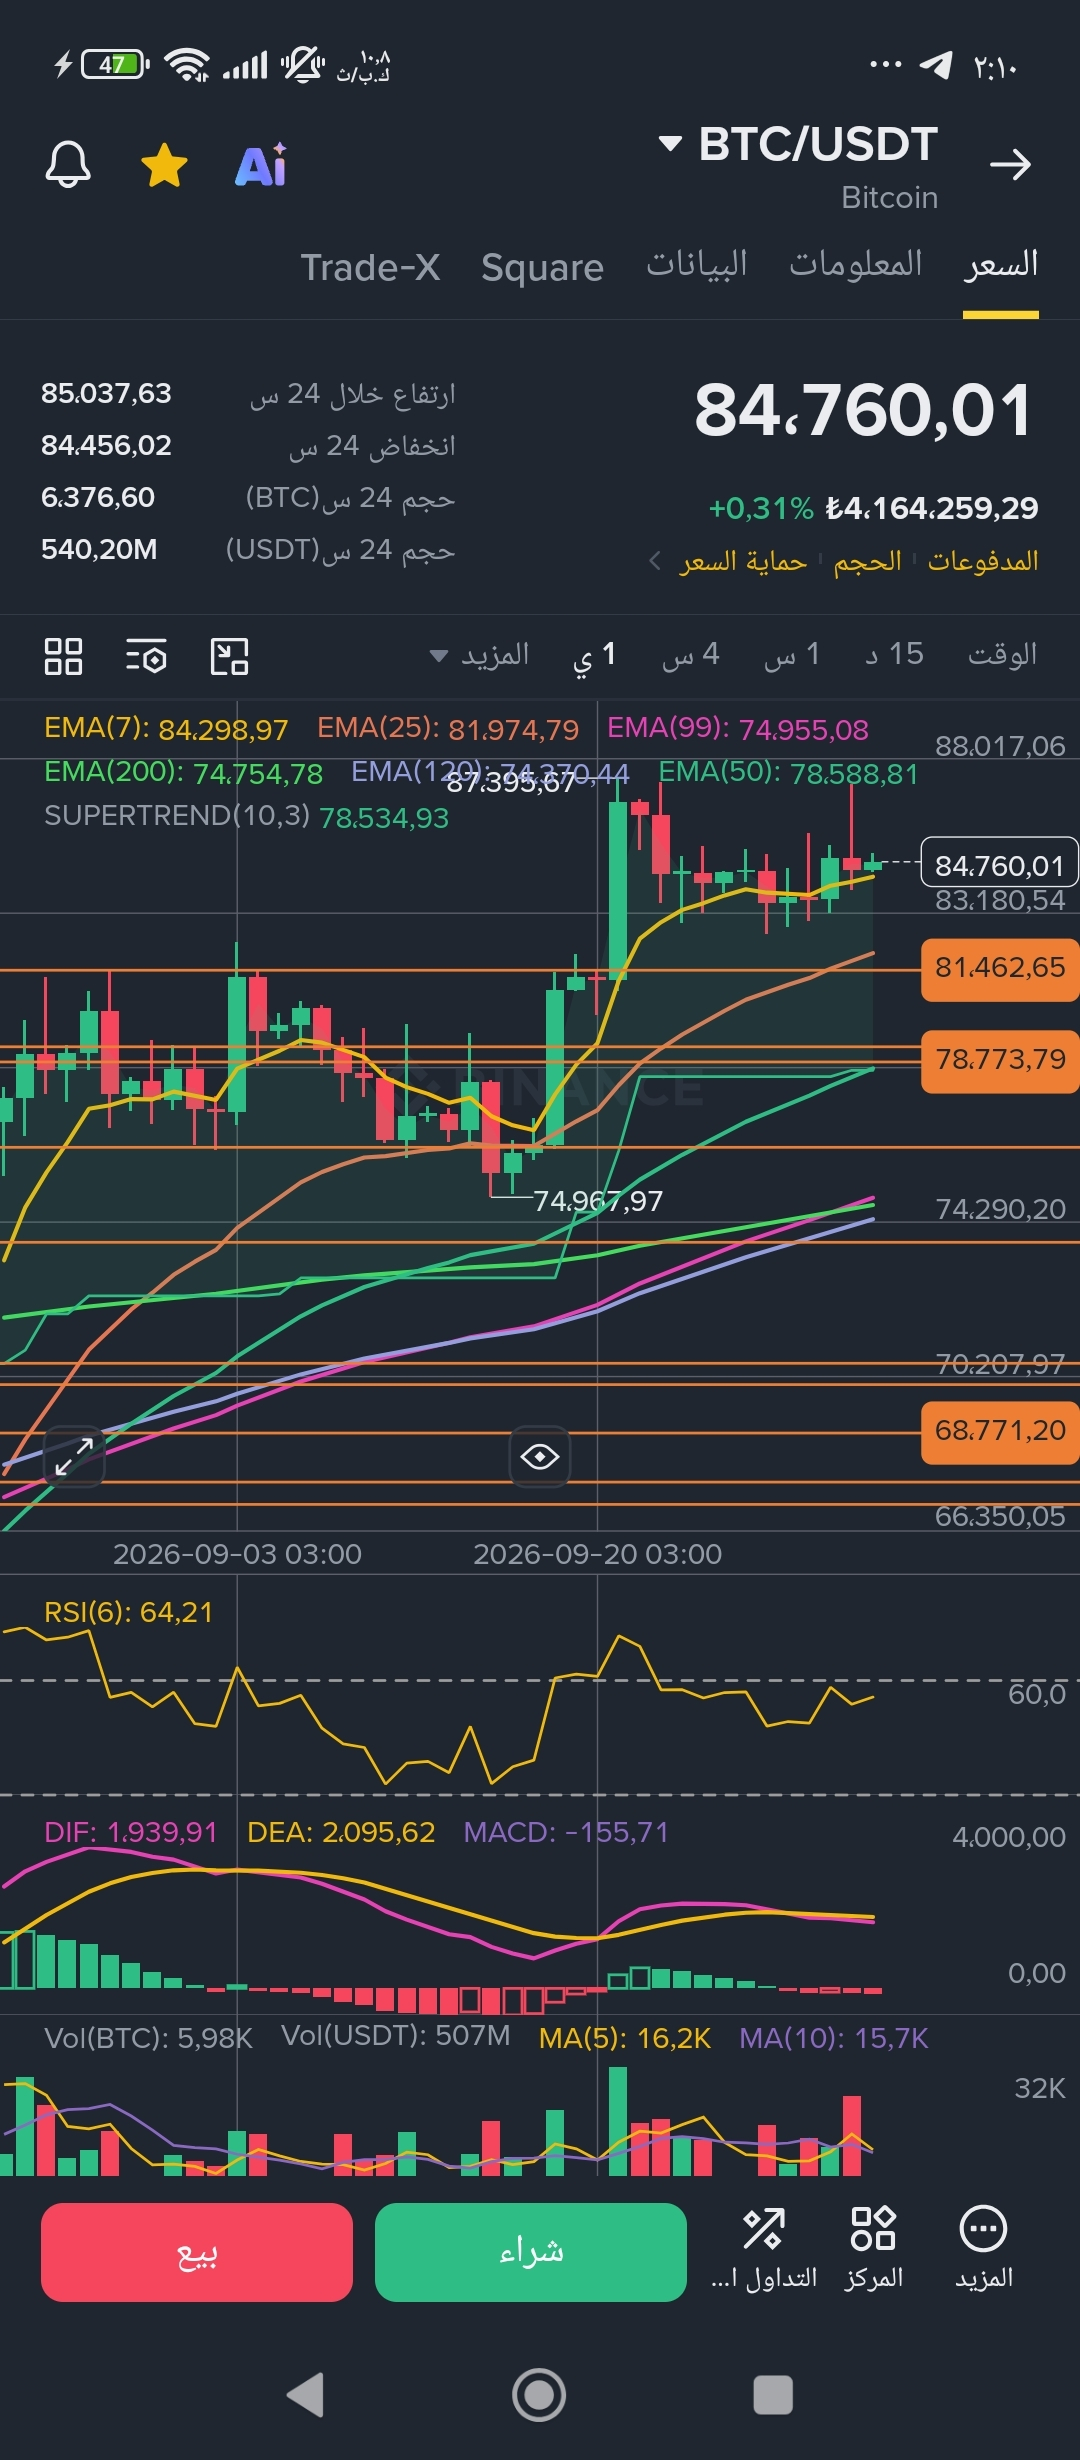
15 days ago, when Bitcoin was trading near 55,400, we mapped potential breakout targets and set monitoring points one after another, reaching 87,648 as the last monitoring level in that phase.
Precisely here, the value of the number appears—not merely its presence on the chart.
87,648 was not a number we saw after the price reached it.
We extracted and identified it before the price even visited it—at a time when there was no prior test and no clear movement on the chart that would tell you that this specific zone carries this technical importance.
We didn’t wait for the price to reach it and then say: “This is resistance.”
Instead, we defined it beforehand as a monitoring point, and then we let the price come to test what we extracted from the analysis.
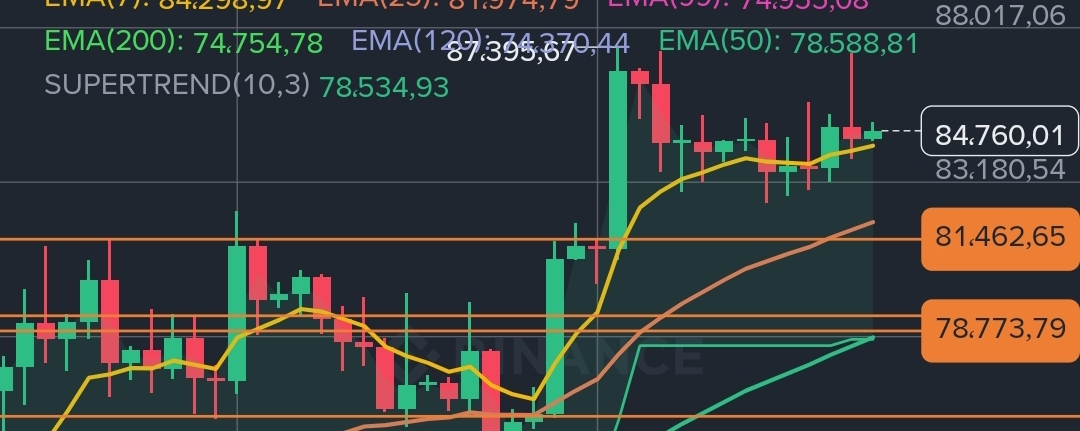
Over the past two weeks, price tested this range twice—and each time it failed to get close in a way that confirms it has enough strength to break through and regain control.
And this is exactly where we know the difference between analysis built after price movement, and analysis that determines the scenario in advance—then leaves it to the price to prove or disprove it.
So we didn’t set 87,648 as the ceiling for the upside or as the end of the move. We set it as the decision point.
We don’t move to new upside targets just because price approaches the zone; instead, we wait for a clear break of 87,648 and for all closes to remain above it.
Only then do we move on to the next test checkpoints:
• 90,360
• 93,575
• 94,550 — the most dangerous technical zone on the structure.
But if the lack persists in front of 87,648, then here begins a completely different reading of the structure and the upcoming scenarios.
🔹 First | Short-term bullish scenario
The price is trading moment by moment near 84,760, and we have 84,473 as the current decision level. Keeping all closes above it keeps the bullish scenario intact.
But there’s a more important condition: we do not allow the liquidity-sweep candle tail to touch 82,775 or break it, even if it’s only the tail of the candle—because if that happens, it distorts the structure of the current uptrend path and leads to a reassessment of the path in the long term.
🔹 Second | The correction range and rebuilding the pattern
We have room for a deeper correction that can be accommodated technically, but within strict conditions.
A liquidity-sweep candle tail toward 80,844 is allowed, but the red line is at 80,126. Touching or breaking this level—even by one dollar—means distorting the formation model on the smaller timeframes.
Here, we don’t announce the end of the rally automatically—we move to testing the possibility of rebuilding the pattern again.
We need a clear swing low near 79,458, with the lowest price not breaking below 78,580.
And it’s not enough to only see a swing low to confirm a reversal; it must be followed by a confirmation candle for the bullish path, with real momentum capable of reclaiming 81,478—along with all closes back above it.
When these conditions come together, what happened can be considered a correction that reshaped the pattern, not the end of the bullish path.
🔹 Third | Failure of the reversal and shift to bearishness
If, however, a swing-low candle appears within the 79,458 – 78,580 range, and then you get a confirmation candle that lacks enough momentum to reclaim the upside levels, then our reading changes.
Instead of the swing-low zone successfully holding the bottom and restoring the uptrend, the attempt may turn into a swing high—and become a point that locks in the bearish path.
Here lies the difference between a successful correction and a failed reversal:
• Swing low + momentum and reclaiming 81,478 = a successful attempt to rebuild the bullish move.
• Swing low + weakness and failure to reclaim = a higher chance of confirming a swing high and completing the decline.
🔹 Fourth | Decision points in the long-term direction
If the bearish path is confirmed and the price fails to rebuild the pattern, our monitoring shifts to two regions of utmost importance:
🔴 76,346 | Breaking the structure
Breaking this zone means breaking the technical structure (Market Structure Break), moving into a more dangerous phase—and it should not be treated as just a passing correction.
🔴 73,674 | Change in the overall trend
Draw a thousand red lines under this number; it is a technical point that represents a change in the overall trend of the entire market. Breaking it means we’re no longer dealing with a correction within the current path, but with a shift in the market’s strategic reading.
⚖️ Summary | We don’t predict the path—we define decision and trigger levels
We have a bullish scenario that requires a break of 87,648, a correction with clear limits, and conditions for rebuilding the pattern and regaining the uptrend. In contrast, the levels whose loss leads to structural distortion and confirming the downtrend path—up to the point where the overall trend changes.
We don’t treat numbers as just traditional supports and resistances; each level has a purpose, each close has meaning, and each candle plays a role in confirming or invalidating the scenario.
More importantly, 87,648 gave us a living example of this idea:
The number was defined before the price arrived—then the price came and tested it, revealing its behavior in front of it.
Here lies the strength of the methodology:
The analysis identifies the number first… and the price is what either gives the reading credibility or invalidates it.
Professionalism isn’t that you catch the direction of price every time—it’s that you know in advance what you will do if price rises, what you will read if it falls, and where your technical judgment changes.
And God knows best.
This is not financial advice; it’s a technical read of the most important potential scenarios—how to interpret each development and deal with it according to what the price reveals to us.
Do your own research, and don’t let anyone think and decide for you… be the owner of your decision.
Good luck to everyone.