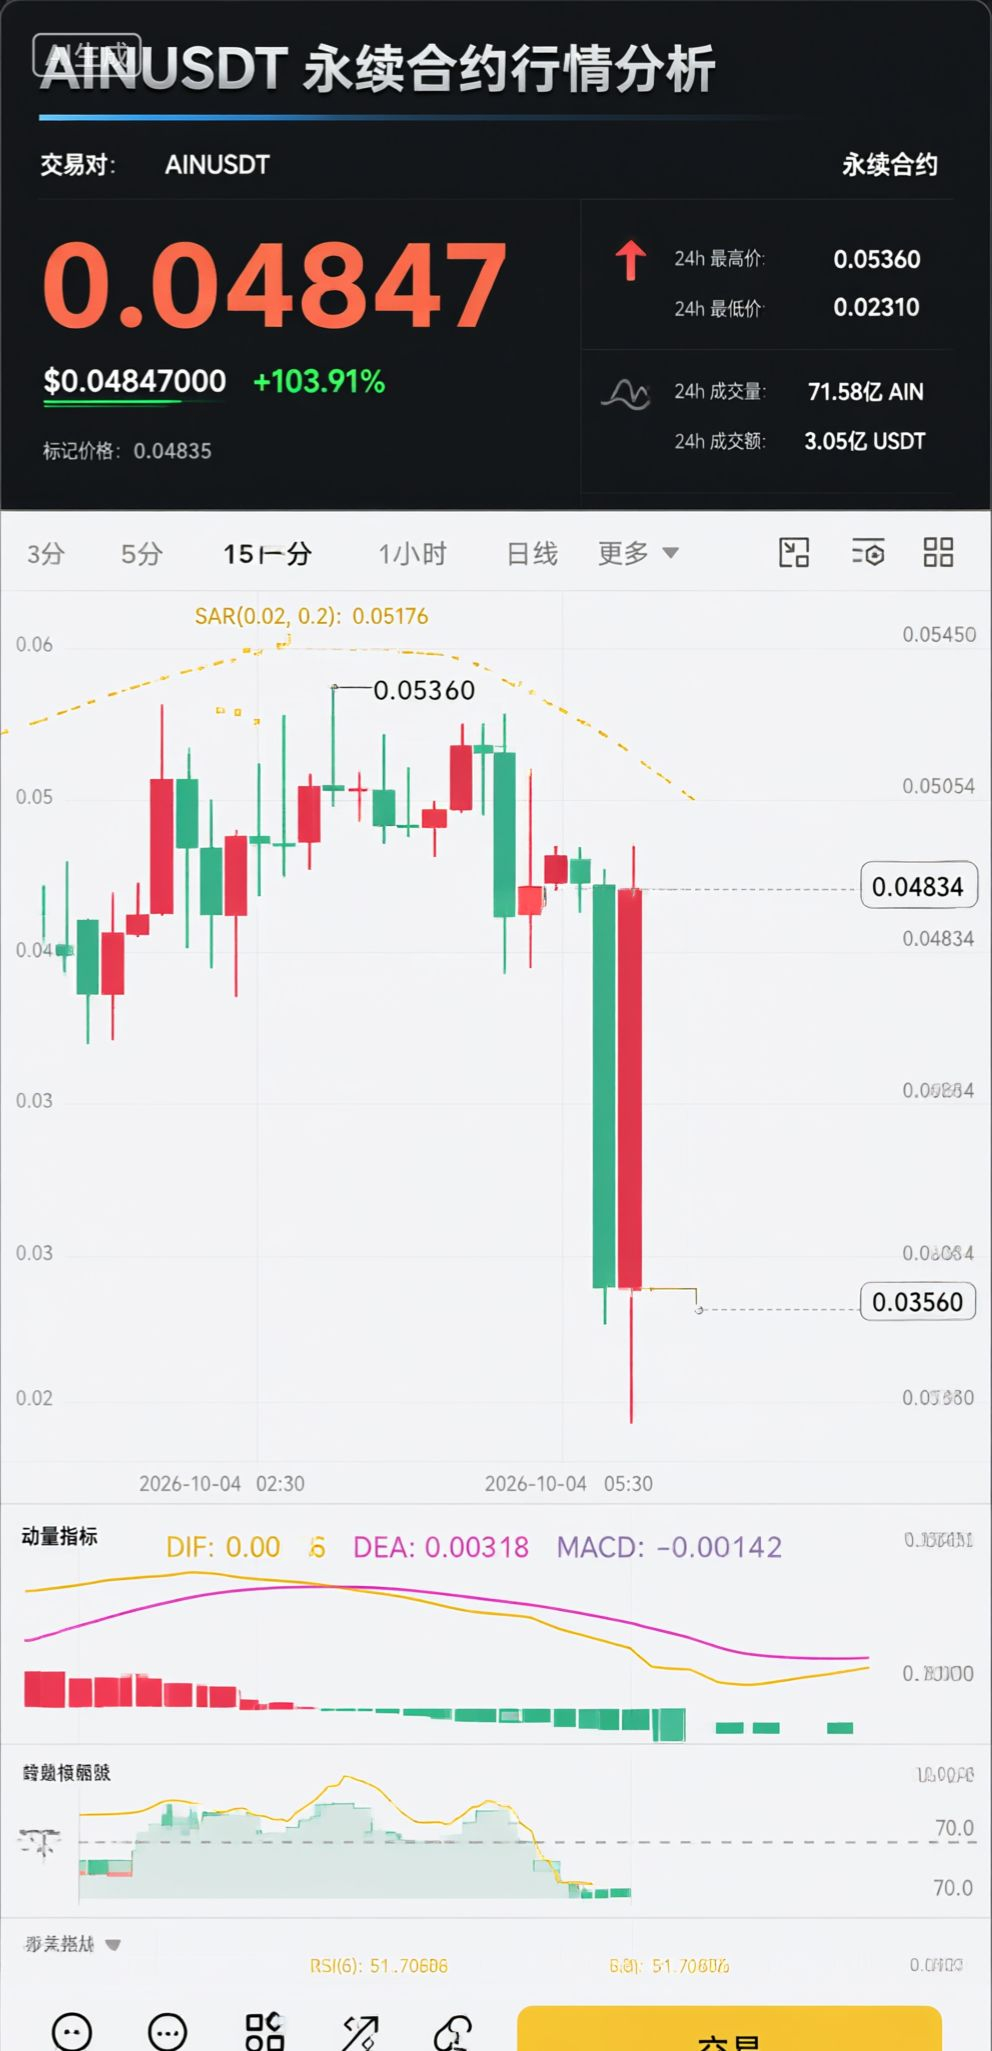
$AIN 15 minutes timeframe shows a “bullish engulfing” signal!
Pay attention to $AIN 最新的 15-minute K-line:
After a wave of sharp pullback shakeout, the bulls quickly launched a counterattack, closing with a large, full-bodied bullish candle.
This not only repaired the previous decline, but also held firmly above the key level of 0.048.
Technical read:
The lower shadow is extremely long, indicating very strong support in the 0.035–0.040 range.
Trading volume expands in tandem—this is real buying power.
Strategy: As long as the breakout point of this bullish candle is not broken, the short-term bias remains bullish.
Where do you see your target price? 0.06 or 0.08?
#BinanceSquare #AIN #技术分析与链上数据 #合约
Pay attention to $AIN 最新的 15-minute K-line:
After a wave of sharp pullback shakeout, the bulls quickly launched a counterattack, closing with a large, full-bodied bullish candle.
This not only repaired the previous decline, but also held firmly above the key level of 0.048.
Technical read:
The lower shadow is extremely long, indicating very strong support in the 0.035–0.040 range.
Trading volume expands in tandem—this is real buying power.
Strategy: As long as the breakout point of this bullish candle is not broken, the short-term bias remains bullish.
Where do you see your target price? 0.06 or 0.08?
#BinanceSquare #AIN #技术分析与链上数据 #合约