📈FN01-Market Technical Analysis: Price Behavior and Structure
I share a technical and detailed review of the current chart of $ESPORTS on Binance Square to evaluate the asset’s structure from a risk management perspective:
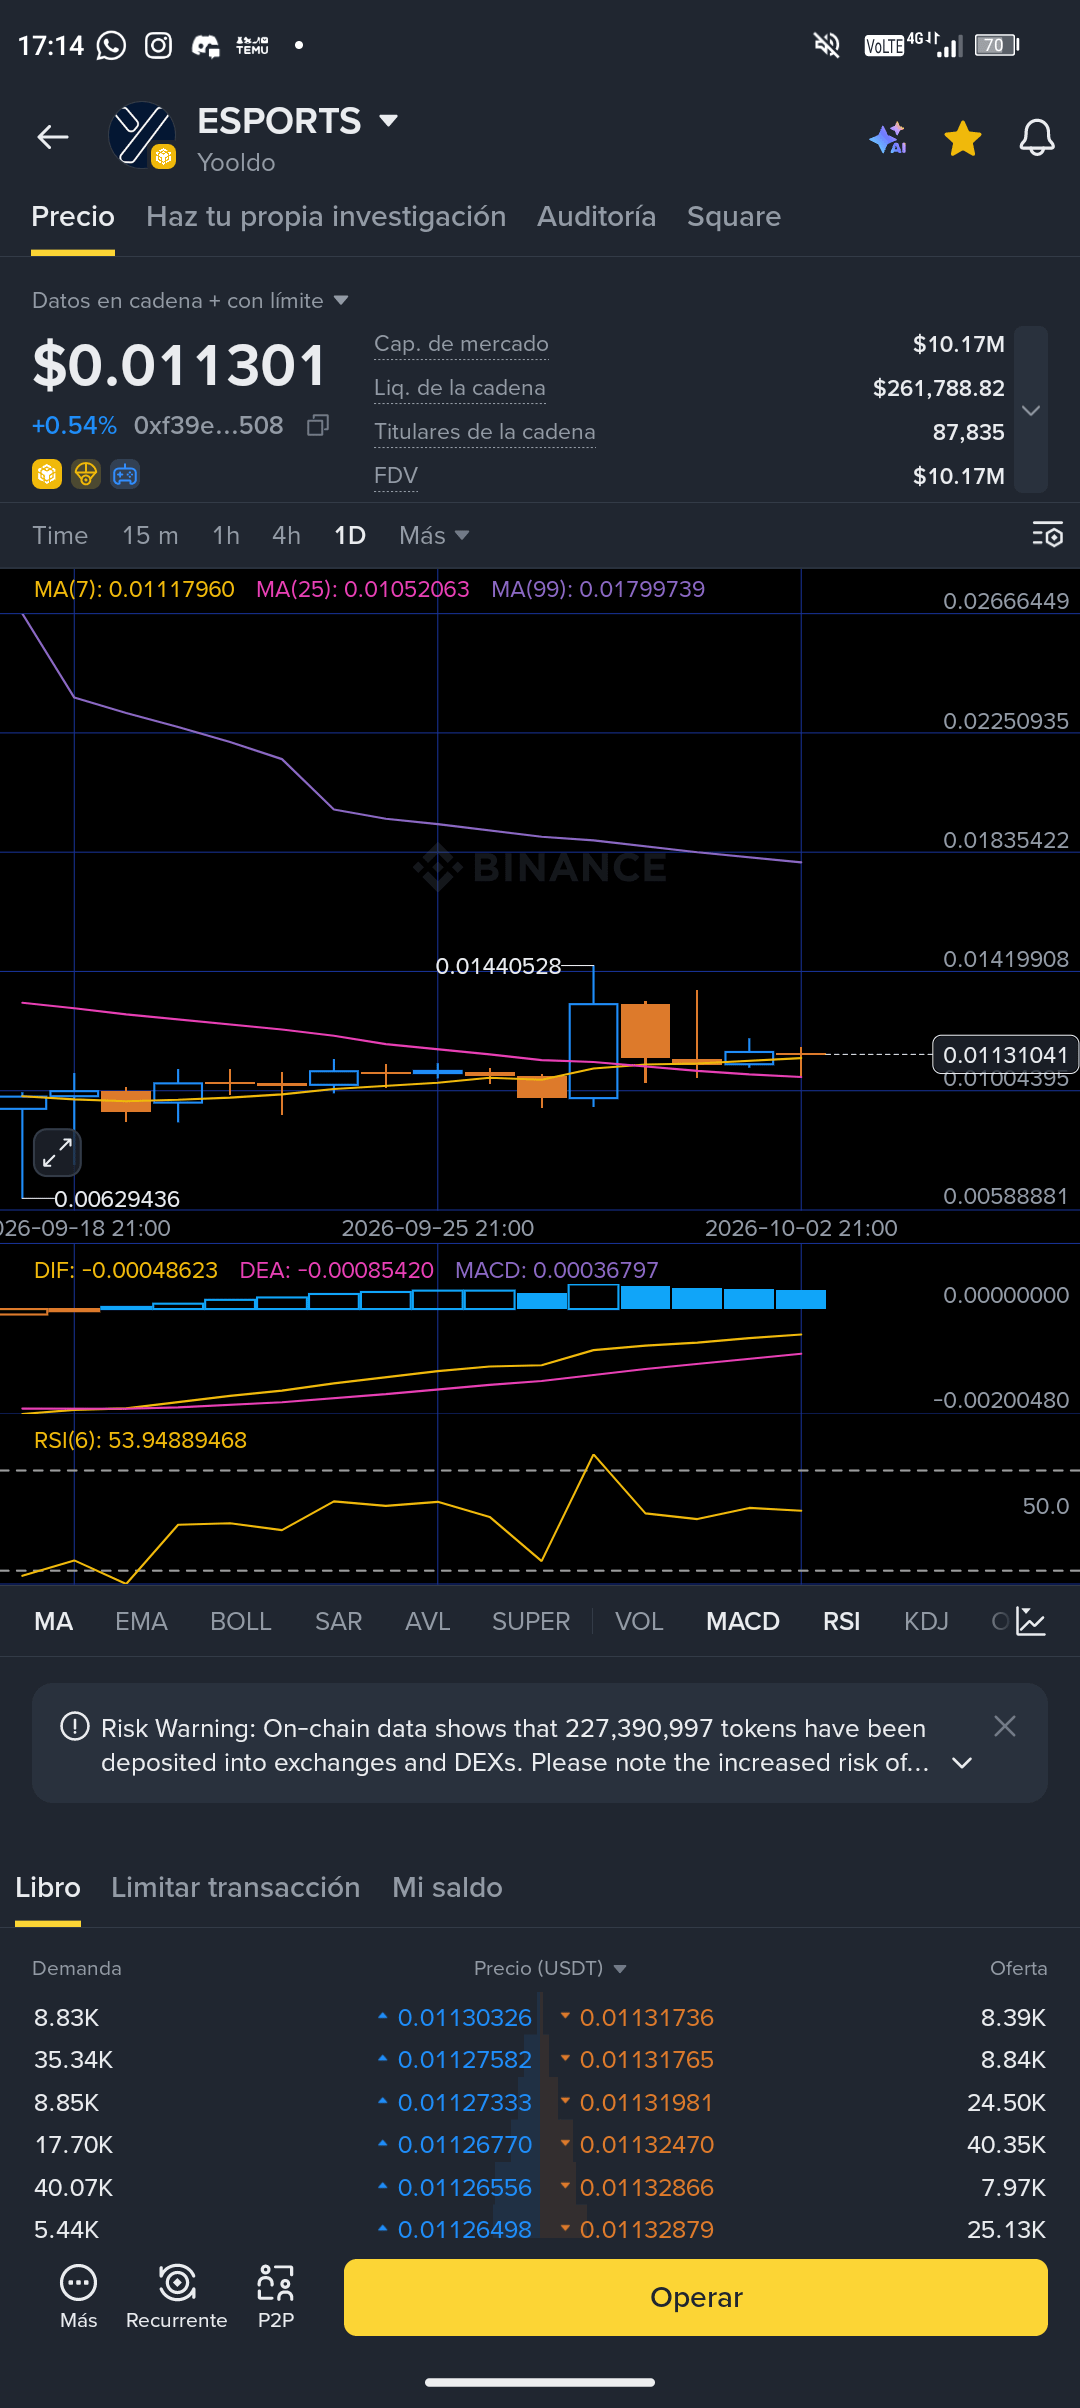
Price Structure and Trend: The asset shows a prior phase of prolonged contraction, finding a zone of stabilization and technical support around 0.0113 USDT after correcting from previous highs.
Moving Averages (MA): The short- and medium-term trend lines (such as MA(7) and MA(25)) reflect flattening after the bearish impulse, indicating a typical phase of sideways consolidation where selling pressure slows down.
Momentum Indicators (RSI and MACD): The RSI is positioned in a neutral zone (around 53), indicating temporary balance between supply and demand without immediate signals of extreme overbought or oversold conditions. The MACD histogram shows stability while waiting for a volume catalyst.
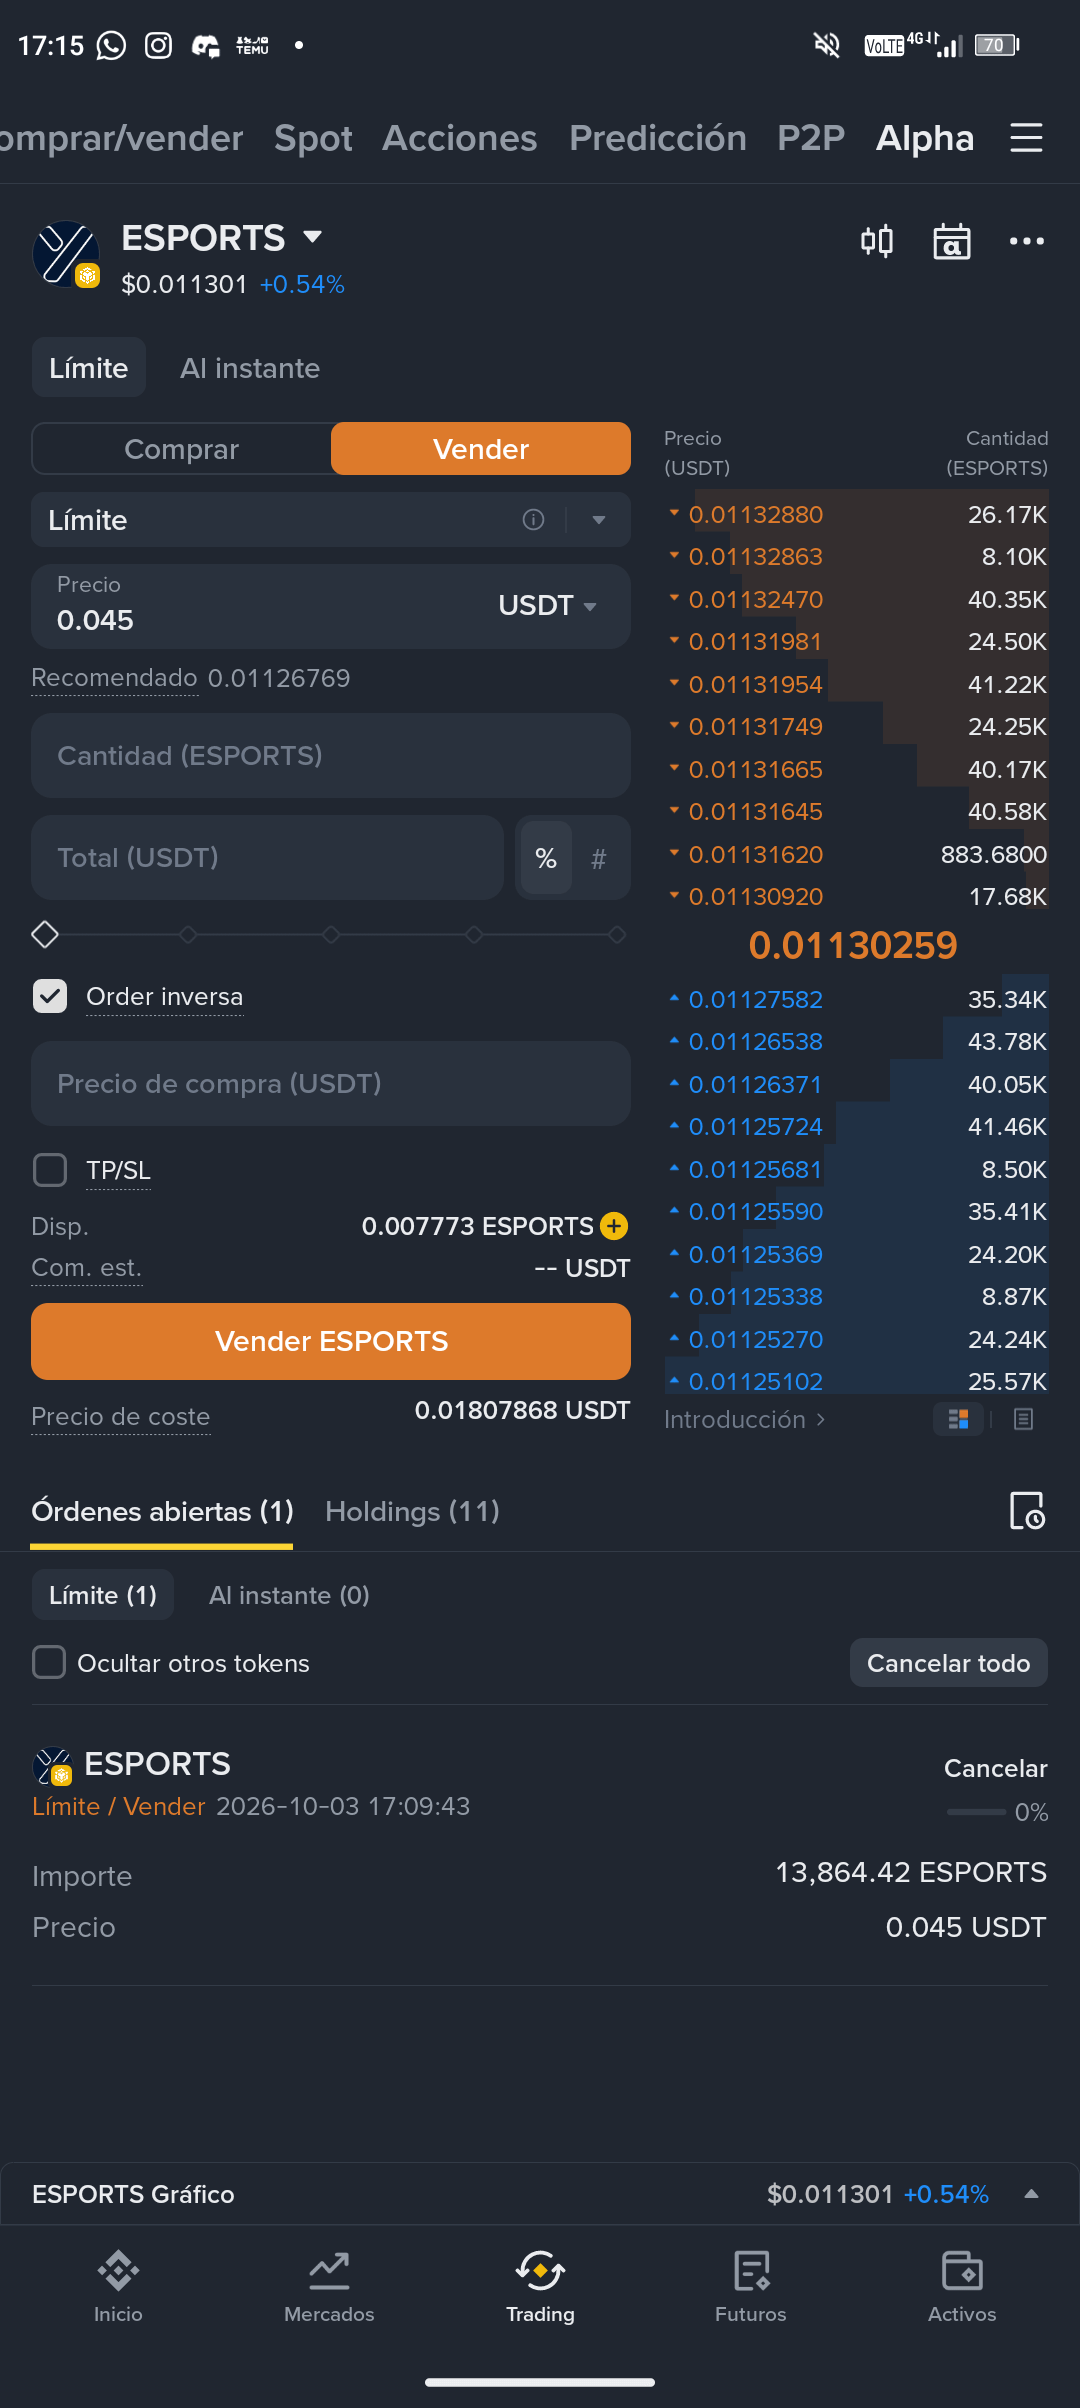
Projection and Key Levels: With a strategically placed limit order in the upper resistance area (target at 0.045 USDT), a liquidity expansion scenario is assessed in case the market reactivates the bullish impulse within its cycle.
I share a technical and detailed review of the current chart of $ESPORTS on Binance Square to evaluate the asset’s structure from a risk management perspective:
Price Structure and Trend: The asset shows a prior phase of prolonged contraction, finding a zone of stabilization and technical support around 0.0113 USDT after correcting from previous highs.
Moving Averages (MA): The short- and medium-term trend lines (such as MA(7) and MA(25)) reflect flattening after the bearish impulse, indicating a typical phase of sideways consolidation where selling pressure slows down.
Momentum Indicators (RSI and MACD): The RSI is positioned in a neutral zone (around 53), indicating temporary balance between supply and demand without immediate signals of extreme overbought or oversold conditions. The MACD histogram shows stability while waiting for a volume catalyst.
Projection and Key Levels: With a strategically placed limit order in the upper resistance area (target at 0.045 USDT), a liquidity expansion scenario is assessed in case the market reactivates the bullish impulse within its cycle.