The bearish reversal pattern is $ZAMA facing possible downward pressure…!!
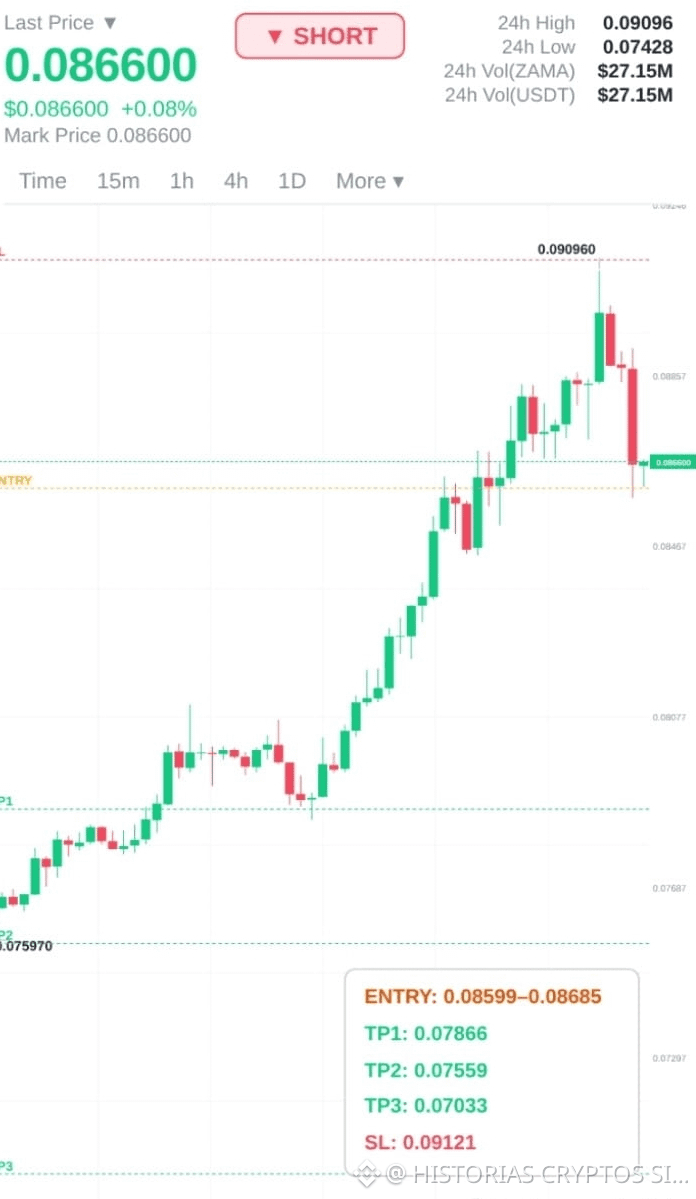
#ZAMA shows signs of a short-term rejection after having reached its maximum at 0.09096, with the price pulling back toward the 0.086600 level after a big rally. The current chart structure reflects an increase in selling pressure from the highs, as the bears try to push the coin below its immediate support zone. If this downward momentum accelerates, the next potential downside targets could be 0.07866 and 0.07559, while 0.09096 acts as the key resistance line that keeps this correction intact
$PUMP $MSFTB
#ZAMA shows signs of a short-term rejection after having reached its maximum at 0.09096, with the price pulling back toward the 0.086600 level after a big rally. The current chart structure reflects an increase in selling pressure from the highs, as the bears try to push the coin below its immediate support zone. If this downward momentum accelerates, the next potential downside targets could be 0.07866 and 0.07559, while 0.09096 acts as the key resistance line that keeps this correction intact
$PUMP $MSFTB