$XMR This spot is kind of interesting.
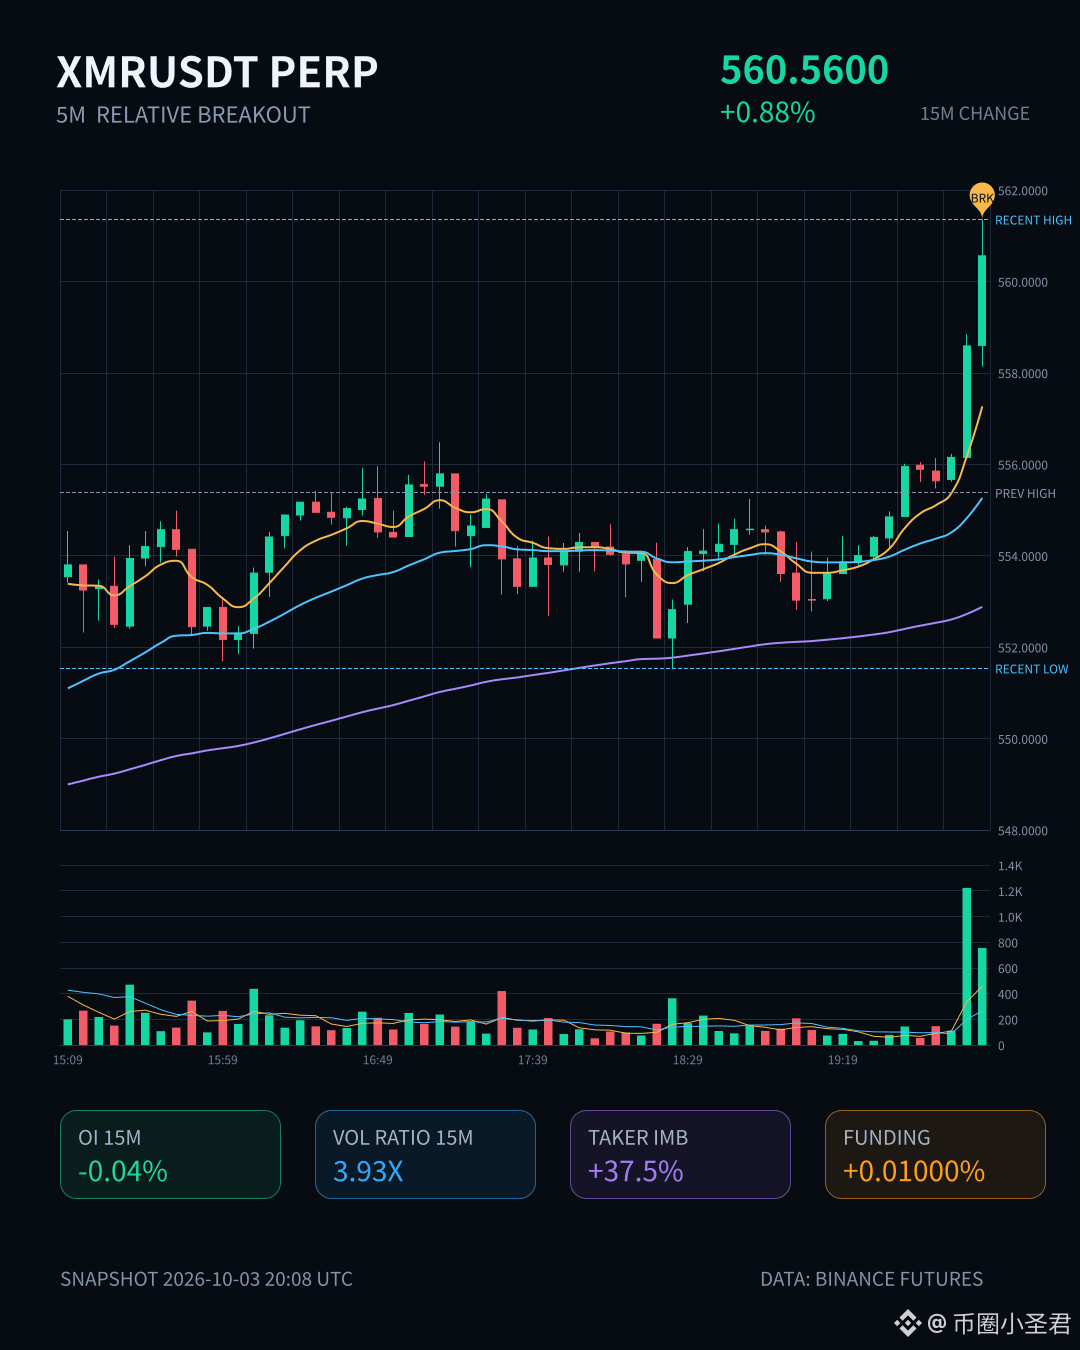
In 15m, it rose with a 0.88% move, and the volume pushed directly to 3.93x; the buy-sell ratio is 2.20, the active-trade imbalance is off by 37.5%. The closing price even broke through the recent peak top line of the last 20 five-minute candles—the price is moving, the volume is following, and the direction is leaning bullish.
But what’s really worth watching isn’t the price—it’s the OI.
In 15m, OI is -0.04%; in 1h, OI is -0.14%. The notional change is only 410K / 592K. Price is rising while OI is actually falling—this doesn’t look like a rally built by new long entries; it looks more like shorts being forced to close and cover. The OI abnormal percentile is 98.6%, ranking #2 across the whole pool. Yet the notional change only ranks #21. The abnormality is maxed out, but the position size hasn’t expanded in sync.
To put it simply: leverage hasn’t been stacked—this is shorts getting squeezed, not longs adding.
And this isn’t just a one-period spike. It continues across multiple consecutive periods; volume is higher than usual, already pressed right up against its own historical extreme zone, and it happens to be right at the boundary of the recent price range.
This structure has a characteristic: the squeeze pushes fast, but the fuel is empty short positions. Once the shorts have covered, and there’s no fresh long “relay” to take over, it’s easy for price to get stuck near the extreme zone—or even give back. So at this level, I’d rather see how it handles the upper boundary of the range than blindly chase a breakout.
$XMR If it holds the upper band and volume/price keep validating, then we talk about the next step. If it can’t hold, it’s a classic pulse of short covering.
In 15m, it rose with a 0.88% move, and the volume pushed directly to 3.93x; the buy-sell ratio is 2.20, the active-trade imbalance is off by 37.5%. The closing price even broke through the recent peak top line of the last 20 five-minute candles—the price is moving, the volume is following, and the direction is leaning bullish.
But what’s really worth watching isn’t the price—it’s the OI.
In 15m, OI is -0.04%; in 1h, OI is -0.14%. The notional change is only 410K / 592K. Price is rising while OI is actually falling—this doesn’t look like a rally built by new long entries; it looks more like shorts being forced to close and cover. The OI abnormal percentile is 98.6%, ranking #2 across the whole pool. Yet the notional change only ranks #21. The abnormality is maxed out, but the position size hasn’t expanded in sync.
To put it simply: leverage hasn’t been stacked—this is shorts getting squeezed, not longs adding.
And this isn’t just a one-period spike. It continues across multiple consecutive periods; volume is higher than usual, already pressed right up against its own historical extreme zone, and it happens to be right at the boundary of the recent price range.
This structure has a characteristic: the squeeze pushes fast, but the fuel is empty short positions. Once the shorts have covered, and there’s no fresh long “relay” to take over, it’s easy for price to get stuck near the extreme zone—or even give back. So at this level, I’d rather see how it handles the upper boundary of the range than blindly chase a breakout.
$XMR If it holds the upper band and volume/price keep validating, then we talk about the next step. If it can’t hold, it’s a classic pulse of short covering.