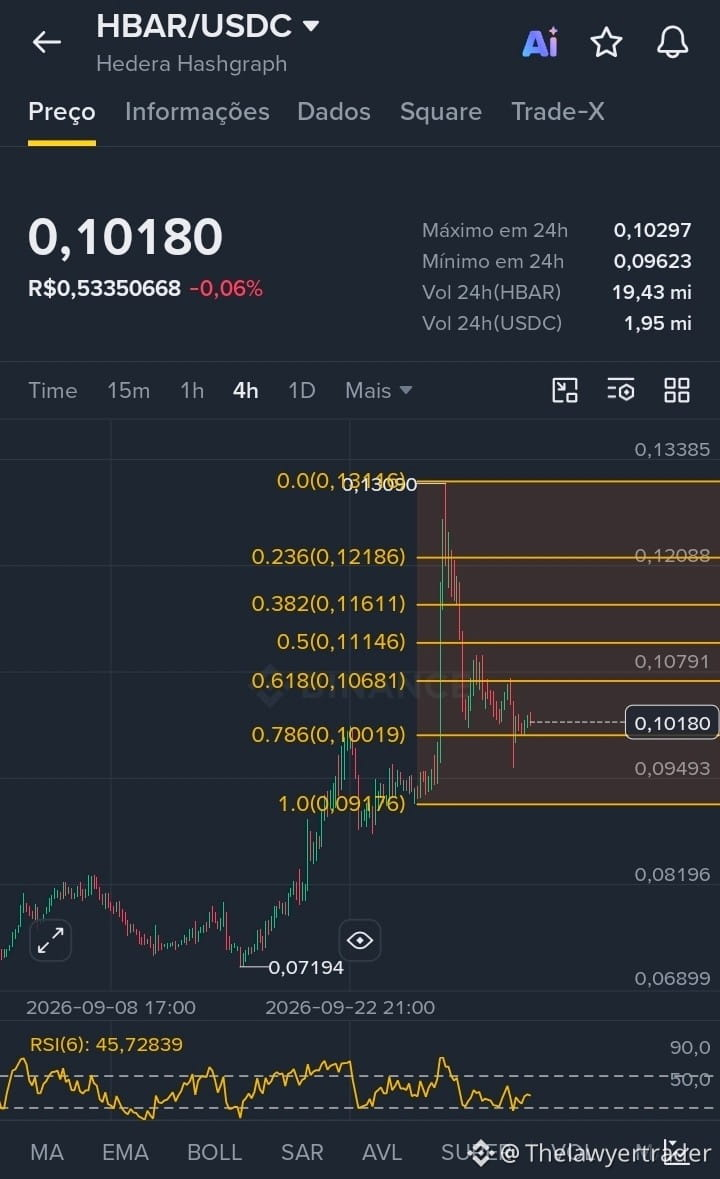
HBAR/USDC Analysis — 4h Chart
Current price: 0.10180 USDC Change: -0.06%
Chart context
HBAR showed a strong rise starting from 0.07194, followed by a correction. At the moment, the price is consolidating sideways, testing the Fibonacci retracement zone between the 0.618 (0.10681) and 0.786 (0.10019) levels.
Visible chart pattern
There is a retracement/correction pattern within an uptrend, with the price settling into a consolidation range. This type of move often precedes the definition of the next direction: either the resumption of the uptrend if support holds, or a deeper correction if the 0.10019 level is broken.
Probability (chart analysis)
Uptrend continuation scenario: moderate to favorable, as long as the price stays above the 0.10019 area (0.786). Consolidation over support reinforces this outlook.
Deeper correction scenario: gains strength only if there is a close below 0.10019, which would open room to test lower levels.
Indicators
RSI(6) at 45.72 indicates a neutral zone, with neither overbought nor oversold conditions. This suggests there is room for movement in either direction, without extremes pointing to immediate exhaustion.
⚠️ Important consideration
Chart analysis is a probability tool, not a certainty. This content is for informational purposes and does not constitute investment advice. Always do your own research and manage risk.
#HBARUSDT $HBAR
Current price: 0.10180 USDC Change: -0.06%
Chart context
HBAR showed a strong rise starting from 0.07194, followed by a correction. At the moment, the price is consolidating sideways, testing the Fibonacci retracement zone between the 0.618 (0.10681) and 0.786 (0.10019) levels.
Visible chart pattern
There is a retracement/correction pattern within an uptrend, with the price settling into a consolidation range. This type of move often precedes the definition of the next direction: either the resumption of the uptrend if support holds, or a deeper correction if the 0.10019 level is broken.
Probability (chart analysis)
Uptrend continuation scenario: moderate to favorable, as long as the price stays above the 0.10019 area (0.786). Consolidation over support reinforces this outlook.
Deeper correction scenario: gains strength only if there is a close below 0.10019, which would open room to test lower levels.
Indicators
RSI(6) at 45.72 indicates a neutral zone, with neither overbought nor oversold conditions. This suggests there is room for movement in either direction, without extremes pointing to immediate exhaustion.
⚠️ Important consideration
Chart analysis is a probability tool, not a certainty. This content is for informational purposes and does not constitute investment advice. Always do your own research and manage risk.
#HBARUSDT $HBAR