📚 LET’S LEARN TOGETHER 🧠🤓: Why does the market “compress” on Saturdays at $BTC ?
After very impulsive moves and high volatility, it’s completely normal for the price to enter a consolidation phase or “range.” On Saturdays, since traditional markets are closed, trading volume usually drops. When this happens, indicators like the Bollinger Bands start to flatten or tighten, building up energy for the next major move.
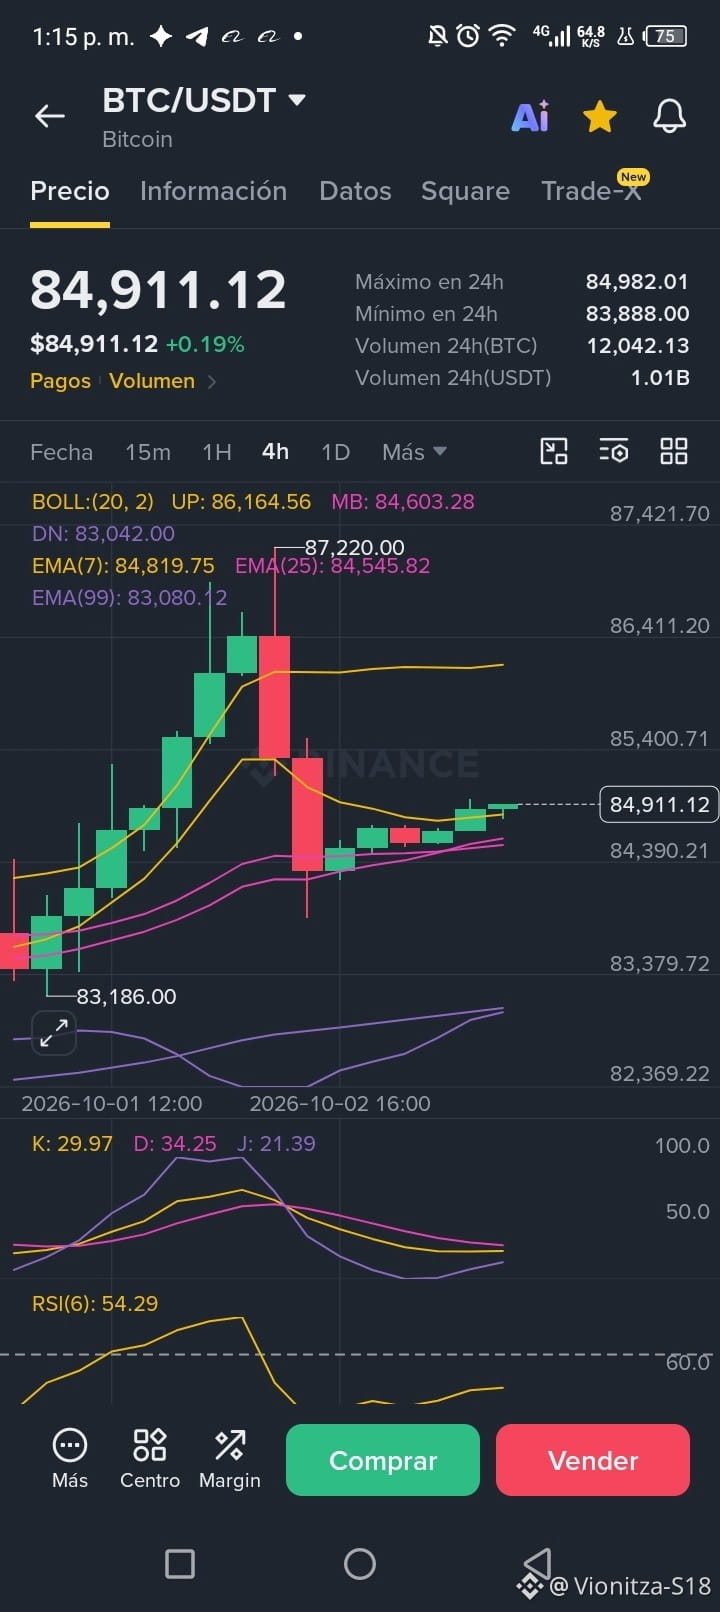
If we look at the 4-hour chart of Bitcoin ($BTC ), we see this exact pattern. The price is trading at $84,911.12 (+0.19%), consolidating in a range of very small candles after correcting from the $87,220 peak.
The key for this weekend is to observe how price has settled millimeter by millimeter over the 7 EMA ($84,819.75) and the 25 EMA ($84,545.82), using them as a solid dynamic support. Also, with the RSI indicator fully neutral at 54.29 points, the market confirms this healthy Saturday pause.
⚡ Learn to identify accumulation phases before you trade!
👇 Tap the buttons on the interactive card of $BTC here below. Open the live chart, review the volatility bands, and set your alerts in 1 click.
👉 Save this post to review this technical pattern and follow me. 💬 Would you rather trade on high-volatility days or when the market is ranging? Let me know in the comments below!
After very impulsive moves and high volatility, it’s completely normal for the price to enter a consolidation phase or “range.” On Saturdays, since traditional markets are closed, trading volume usually drops. When this happens, indicators like the Bollinger Bands start to flatten or tighten, building up energy for the next major move.
If we look at the 4-hour chart of Bitcoin ($BTC ), we see this exact pattern. The price is trading at $84,911.12 (+0.19%), consolidating in a range of very small candles after correcting from the $87,220 peak.
The key for this weekend is to observe how price has settled millimeter by millimeter over the 7 EMA ($84,819.75) and the 25 EMA ($84,545.82), using them as a solid dynamic support. Also, with the RSI indicator fully neutral at 54.29 points, the market confirms this healthy Saturday pause.
⚡ Learn to identify accumulation phases before you trade!
👇 Tap the buttons on the interactive card of $BTC here below. Open the live chart, review the volatility bands, and set your alerts in 1 click.
👉 Save this post to review this technical pattern and follow me. 💬 Would you rather trade on high-volatility days or when the market is ranging? Let me know in the comments below!