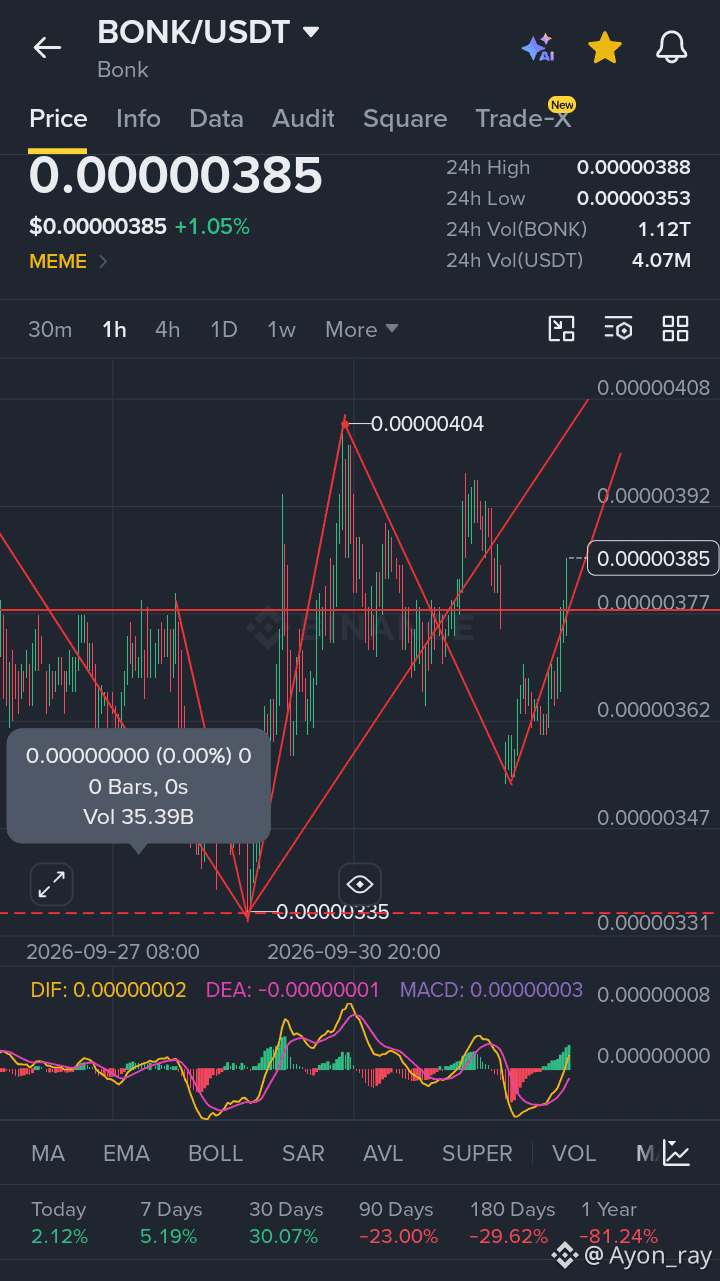
$BONK Analysis Overview:
Current Price: 0.00000385 (+1.05%)
24h High / Low: 0.00000388 / 0.00000353
24h Volume: 1.12T BONK (approx. $4.07M USDT)
Key Highlights & Technical Patterns:
Double Bottom / Trend Reversal: The chart illustrates a distinct "W" pattern (Double Bottom) rebound from a local low near 0.00000335, pushing back up toward major resistance levels.
Resistance & Targets: Near-term resistance lies around 0.00000388–0.00000404, with higher projections indicated by trendlines extending toward 0.00000408+.
MACD Indicator: The MACD shows a bullish crossover (DIF line moving above the DEA line with green histogram bars), signaling growing upward momentum.
Performance Context: Short-term recovery is active (+5.19% over 7 days, +30.07% over 30 days), though higher timeframe performance remains negative (-23.00% over 90 days).
#Bonk
#Binance
#crypto
Current Price: 0.00000385 (+1.05%)
24h High / Low: 0.00000388 / 0.00000353
24h Volume: 1.12T BONK (approx. $4.07M USDT)
Key Highlights & Technical Patterns:
Double Bottom / Trend Reversal: The chart illustrates a distinct "W" pattern (Double Bottom) rebound from a local low near 0.00000335, pushing back up toward major resistance levels.
Resistance & Targets: Near-term resistance lies around 0.00000388–0.00000404, with higher projections indicated by trendlines extending toward 0.00000408+.
MACD Indicator: The MACD shows a bullish crossover (DIF line moving above the DEA line with green histogram bars), signaling growing upward momentum.
Performance Context: Short-term recovery is active (+5.19% over 7 days, +30.07% over 30 days), though higher timeframe performance remains negative (-23.00% over 90 days).
#Bonk
#Binance
#crypto