Analysis of the SOL/USDT asset
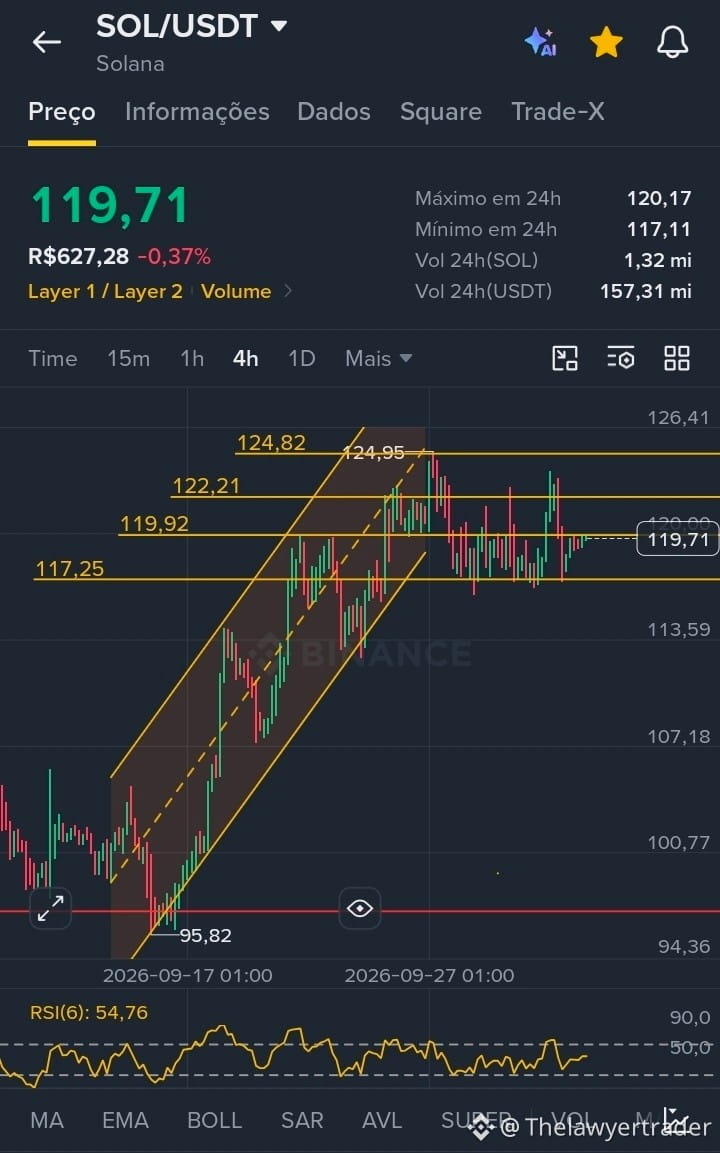
The SOL/USDT pair, on the 4-hour chart, shows a period of indecision after a strong rally. The current price is 119.71 USDT, with a slight drop of 0.37% over the period.
Visible chart pattern:
The asset had been trading within an upward channel, but it recently broke below the lower base of that channel. This indicates a loss of momentum and an entry into a phase of sideways consolidation. The price is oscillating between resistance at 122.21 and support at 117.25, with the recent top at 124.95.
Indicators:
RSI(6) is at 54.76, in the neutral zone, showing no signs of overbought or oversold conditions. This supports the current sideways movement and the lack of a clear direction in the short term.
Pattern probability:
Sideways consolidation has a moderate probability of continuing as long as price does not break the extremes of the range. Maintaining support at 117.25 is crucial to avoid a deeper correction. Breaking above 122.21, with volume, would be necessary to resume the previous uptrend.
Conclusion:
The market is in a wait-and-see mode. Caution is recommended, and you should wait for a clear breakout from one of the range extremes before taking new positions, always with proper risk management.
#sol $SOL
The SOL/USDT pair, on the 4-hour chart, shows a period of indecision after a strong rally. The current price is 119.71 USDT, with a slight drop of 0.37% over the period.
Visible chart pattern:
The asset had been trading within an upward channel, but it recently broke below the lower base of that channel. This indicates a loss of momentum and an entry into a phase of sideways consolidation. The price is oscillating between resistance at 122.21 and support at 117.25, with the recent top at 124.95.
Indicators:
RSI(6) is at 54.76, in the neutral zone, showing no signs of overbought or oversold conditions. This supports the current sideways movement and the lack of a clear direction in the short term.
Pattern probability:
Sideways consolidation has a moderate probability of continuing as long as price does not break the extremes of the range. Maintaining support at 117.25 is crucial to avoid a deeper correction. Breaking above 122.21, with volume, would be necessary to resume the previous uptrend.
Conclusion:
The market is in a wait-and-see mode. Caution is recommended, and you should wait for a clear breakout from one of the range extremes before taking new positions, always with proper risk management.
#sol $SOL