📉 $BR USDT: Severe oversold — don’t chase the drop!
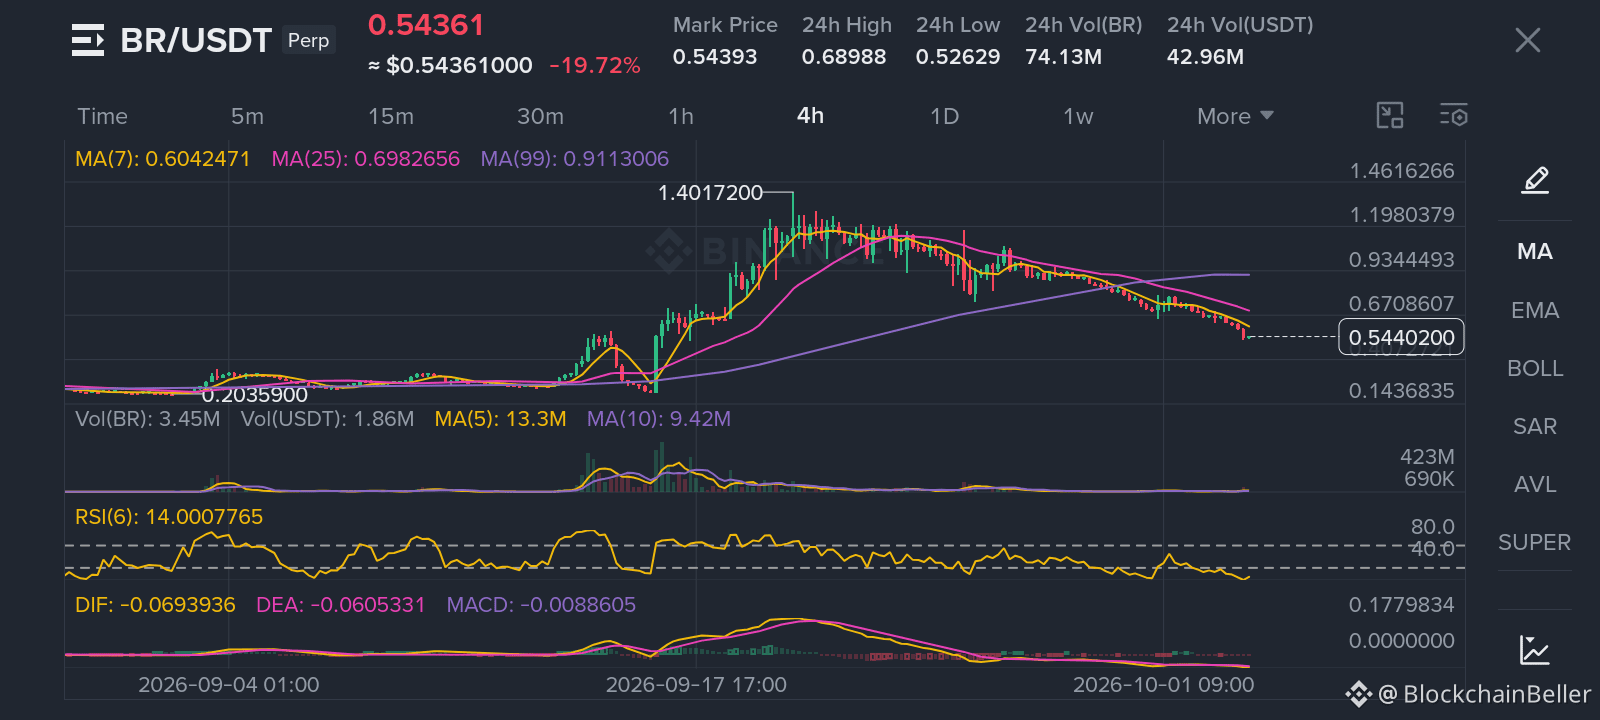
The 4-hour chart for the coin $BR shows an aggressive bearish structure. After reaching the peak of 1.4017, the price began recording lower highs and lower lows, leading to a sharp breakdown of supports.
📊 Quick technical view:
• The price is clearly trading below all major moving averages, confirming strong bearish control.
• The Relative Strength Index is at 14.00, indicating severe oversold conditions.
• The recent breakout below 0.6000 occurred behind a block of sell orders around the 0.6700 – 0.6900 zone.
⚠️ Trading strategy (sell on retest):
Avoid selling at the current price (0.5436) while the RSI is in the oversold zone. A bullish corrective bounce is very likely. The best possible trade is to wait for the price to return and test the broken resistance around 0.6000 – 0.6200, then sell from there.
🎯 Trading plan ($BR ):
🔴 Direction: Sell (on retest)
📥 Entry zone: 0.6000 – 0.6200
🛑 Stop loss: 0.6700 (above the previous high / order block)
✅ Target 1: 0.5260 (lowest price in the last 24 hours)
✅ Target 2: 0.5000 (psychological support)
🔍 Confirmation: wait for a clear rejection tail or a strong bearish candle in the entry zone.
❌ Trade invalidation: a 4-hour candle closes above 0.6700.
Protect your capital. Let the market come to you. 🛡️
The 4-hour chart for the coin $BR shows an aggressive bearish structure. After reaching the peak of 1.4017, the price began recording lower highs and lower lows, leading to a sharp breakdown of supports.
📊 Quick technical view:
• The price is clearly trading below all major moving averages, confirming strong bearish control.
• The Relative Strength Index is at 14.00, indicating severe oversold conditions.
• The recent breakout below 0.6000 occurred behind a block of sell orders around the 0.6700 – 0.6900 zone.
⚠️ Trading strategy (sell on retest):
Avoid selling at the current price (0.5436) while the RSI is in the oversold zone. A bullish corrective bounce is very likely. The best possible trade is to wait for the price to return and test the broken resistance around 0.6000 – 0.6200, then sell from there.
🎯 Trading plan ($BR ):
🔴 Direction: Sell (on retest)
📥 Entry zone: 0.6000 – 0.6200
🛑 Stop loss: 0.6700 (above the previous high / order block)
✅ Target 1: 0.5260 (lowest price in the last 24 hours)
✅ Target 2: 0.5000 (psychological support)
🔍 Confirmation: wait for a clear rejection tail or a strong bearish candle in the entry zone.
❌ Trade invalidation: a 4-hour candle closes above 0.6700.
Protect your capital. Let the market come to you. 🛡️