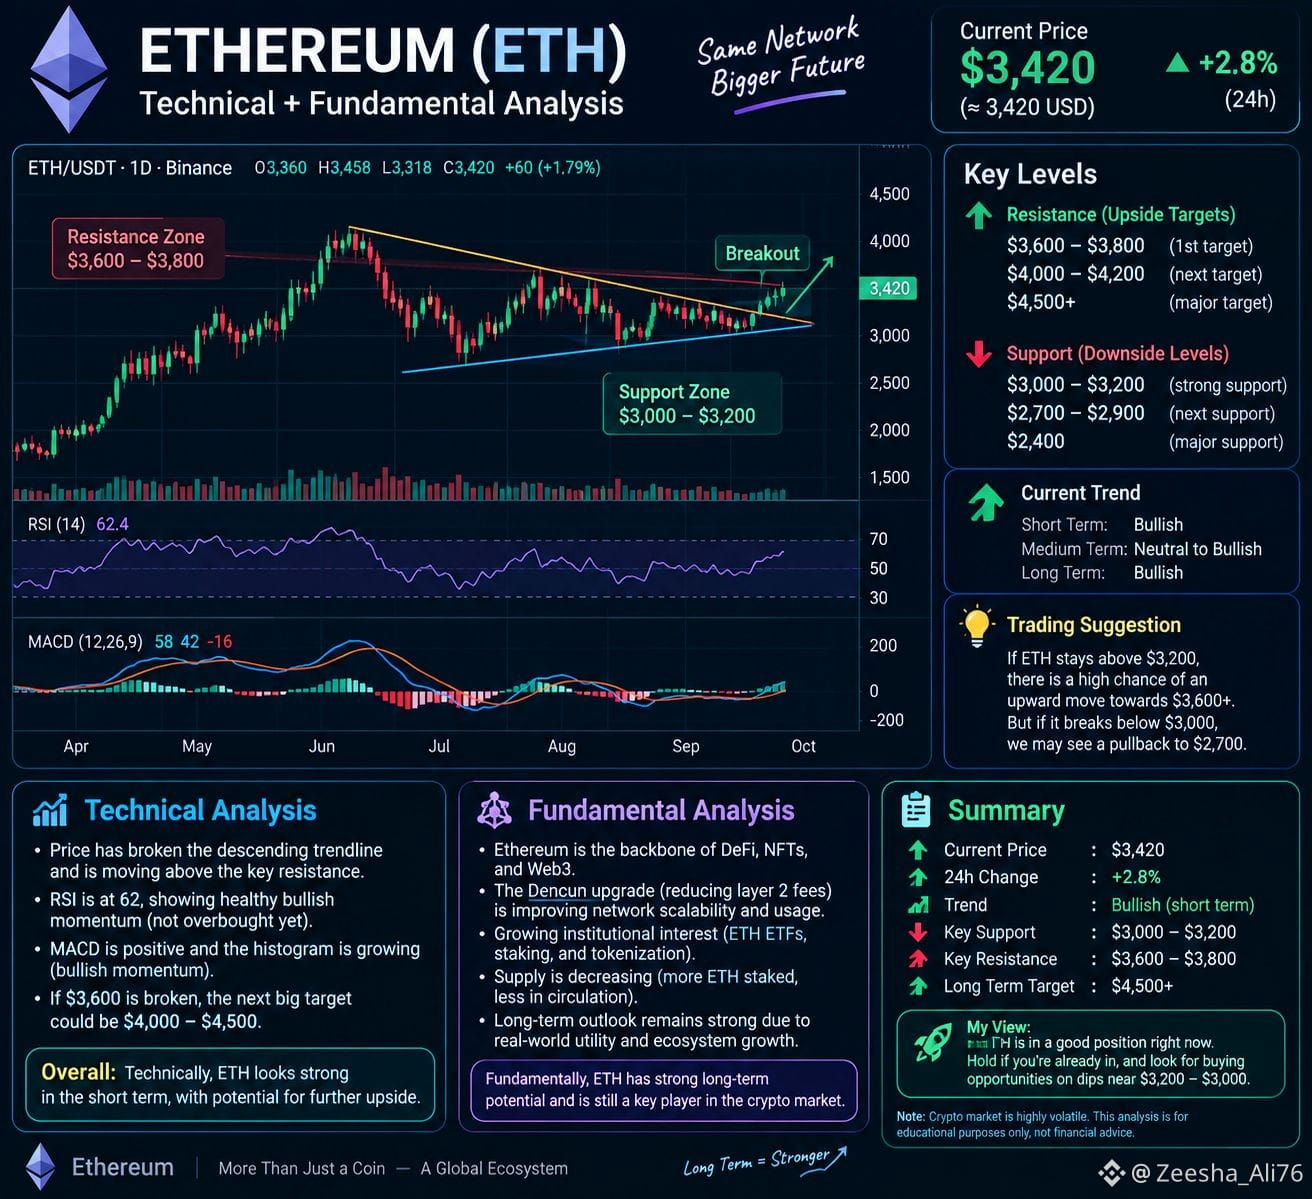
$ETH Current Analysis — 3 Oct 2026
Current price: approximately $2,680
ETH today is approximately 1.5% down.
Technical picture:
🟢 Support: $2,650–$2,680
🟡 If it holds at $2,650, it may retest $2,800 again.
🔴 If $2,650 breaks decisively, the next important area is approximately $2,500.
ETH is currently above its 50-day (~$2,465) and 200-day (~$2,315) averages, which is important for the medium-term structure.
Short-term view: ETH is currently in the decision zone within the $2,650–$2,800 range. If strength comes above $2,800, upside momentum could improve; weakness could increase below $2,650.
Fundamental: In the recent 3 trading sessions, U.S. spot ETH ETFs reported approximately $118M net outflows, which is putting pressure on short-term demand.
Chart picture: You can see the current ETH movement in the live chart above.
#GreekPoliceBustCryptoScamRingArrest17
#FedOctoberRateHikeOddsFallTo17%
Current price: approximately $2,680
ETH today is approximately 1.5% down.
Technical picture:
🟢 Support: $2,650–$2,680
🟡 If it holds at $2,650, it may retest $2,800 again.
🔴 If $2,650 breaks decisively, the next important area is approximately $2,500.
ETH is currently above its 50-day (~$2,465) and 200-day (~$2,315) averages, which is important for the medium-term structure.
Short-term view: ETH is currently in the decision zone within the $2,650–$2,800 range. If strength comes above $2,800, upside momentum could improve; weakness could increase below $2,650.
Fundamental: In the recent 3 trading sessions, U.S. spot ETH ETFs reported approximately $118M net outflows, which is putting pressure on short-term demand.
Chart picture: You can see the current ETH movement in the live chart above.
#GreekPoliceBustCryptoScamRingArrest17
#FedOctoberRateHikeOddsFallTo17%