
🔥 $LITEB /USDT — THE BATTLE IS ON! ⚡
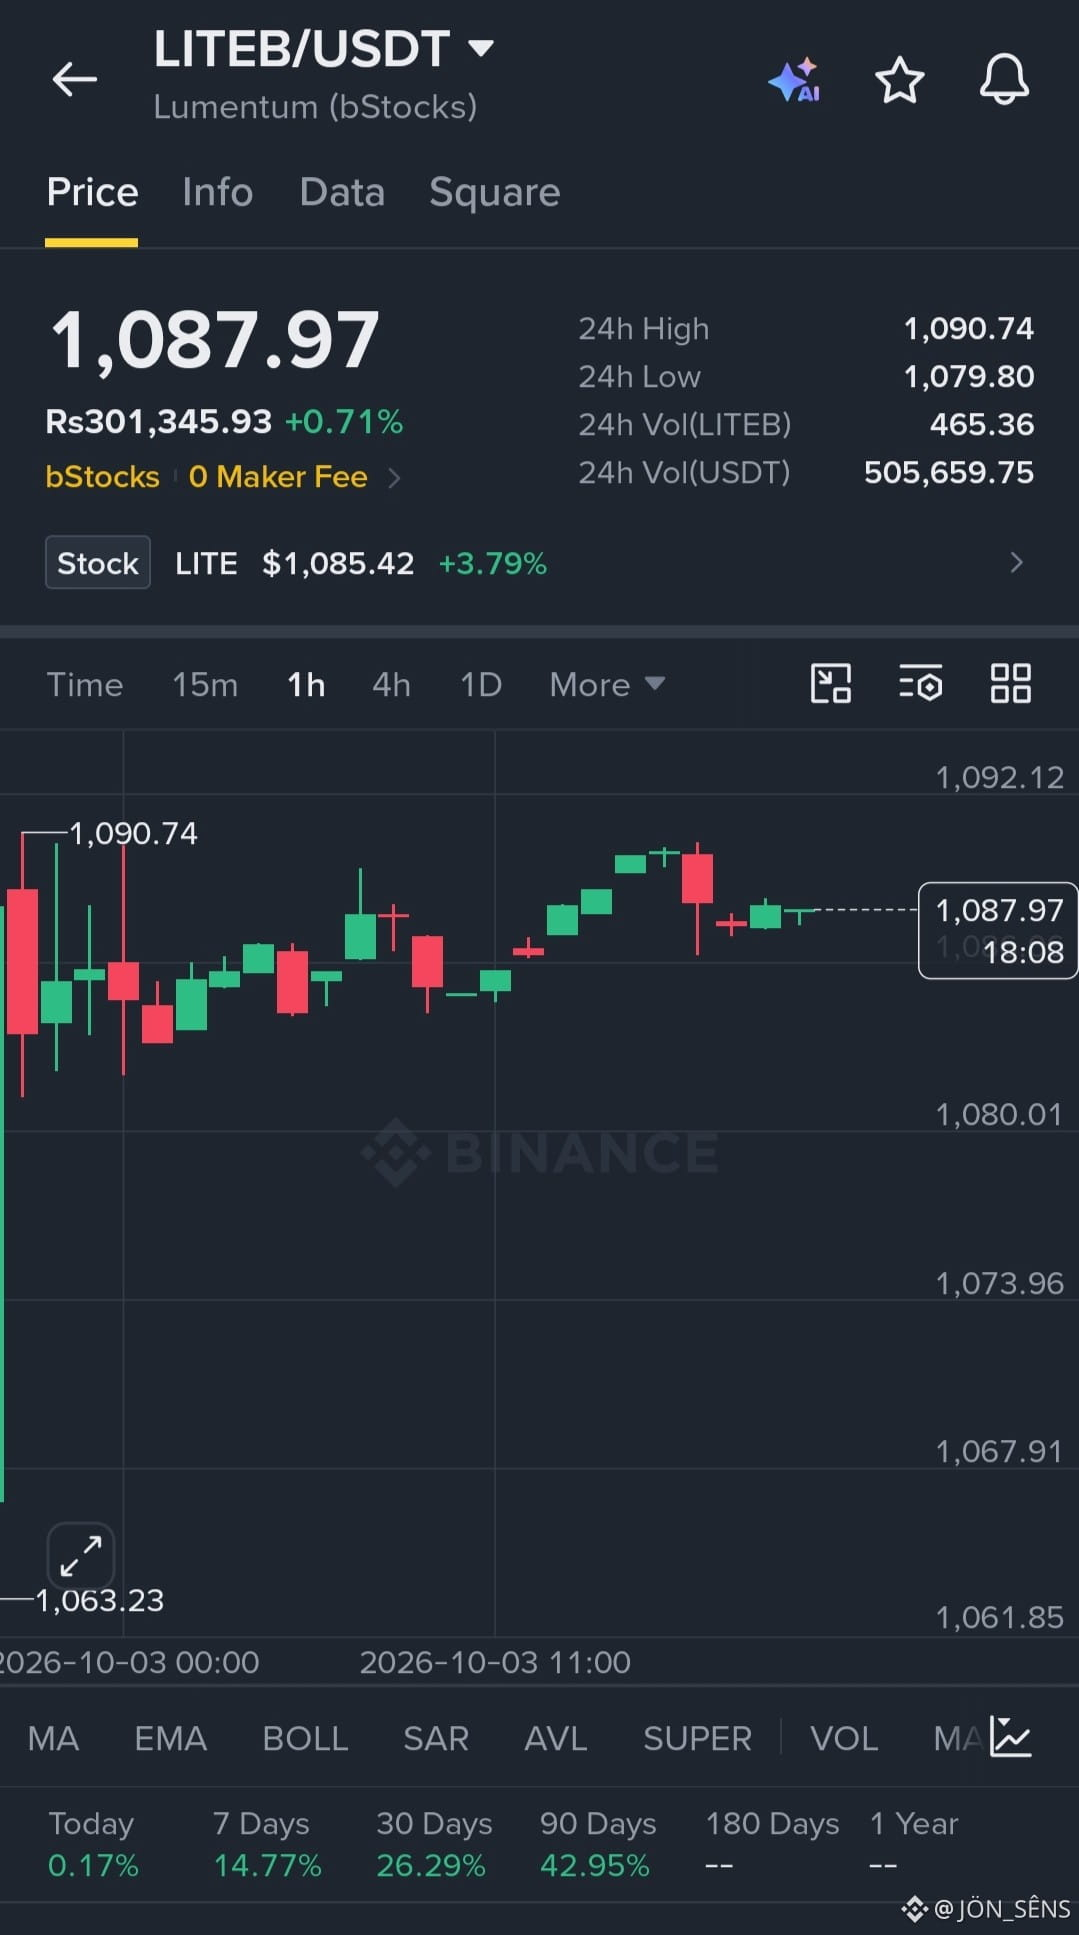
LITEB is sitting at 1,087.97 USDT, up +0.71% in 24H. The chart is getting interesting because price is pressing close to the day’s high while momentum remains positive.
📊 Market Snapshot
💰 Price: 1,087.97
🟢 24H Change: +0.71%
🚀 24H High: 1,090.74
🔻 24H Low: 1,079.80
📦 Volume: 465.36 LITEB
💵 Volume: 505,659.75 USDT
🏷️ LITE stock: 1,085.42 | +3.79%
📈 Momentum is strong
Today: +0.17%
7 Days: +14.77%
30 Days: +26.29%
90 Days: +42.95%
⚔️ UP vs DOWN — The Key Levels
🚀 Bullish side:
A clean push above 1,090.74 could put 1,092.12 immediately in focus. If buyers can hold above that area, the breakout structure becomes more interesting.
🧱 Resistance:
1,090.74 → 1,092.12
🛡️ Support side:
First important zone is around 1,080.00–1,079.80. Losing that area could expose 1,073.96, followed by 1,067.91.
⚠️ The chart also shows a much deeper intraday wick around 1,063.23, so volatility can clearly get wild when liquidity moves.
🎯 The setup in one line:
Above 1,090.74 = buyers testing the breakout.
Below 1,079.80 = sellers start testing support.
Right now, LITEB is basically sitting in the middle of a tight 1H battle zone—buyers are trying to reclaim the highs, while sellers are defending the 1,090–1,092 region. 👀🔥
No crystal ball here—watch the breakout AND the breakdown. Let price confirm the direction. 📈📉
LITEB is sitting at 1,087.97 USDT, up +0.71% in 24H. The chart is getting interesting because price is pressing close to the day’s high while momentum remains positive.
📊 Market Snapshot
💰 Price: 1,087.97
🟢 24H Change: +0.71%
🚀 24H High: 1,090.74
🔻 24H Low: 1,079.80
📦 Volume: 465.36 LITEB
💵 Volume: 505,659.75 USDT
🏷️ LITE stock: 1,085.42 | +3.79%
📈 Momentum is strong
Today: +0.17%
7 Days: +14.77%
30 Days: +26.29%
90 Days: +42.95%
⚔️ UP vs DOWN — The Key Levels
🚀 Bullish side:
A clean push above 1,090.74 could put 1,092.12 immediately in focus. If buyers can hold above that area, the breakout structure becomes more interesting.
🧱 Resistance:
1,090.74 → 1,092.12
🛡️ Support side:
First important zone is around 1,080.00–1,079.80. Losing that area could expose 1,073.96, followed by 1,067.91.
⚠️ The chart also shows a much deeper intraday wick around 1,063.23, so volatility can clearly get wild when liquidity moves.
🎯 The setup in one line:
Above 1,090.74 = buyers testing the breakout.
Below 1,079.80 = sellers start testing support.
Right now, LITEB is basically sitting in the middle of a tight 1H battle zone—buyers are trying to reclaim the highs, while sellers are defending the 1,090–1,092 region. 👀🔥
No crystal ball here—watch the breakout AND the breakdown. Let price confirm the direction. 📈📉