
AIN/USDT is making a huge move!
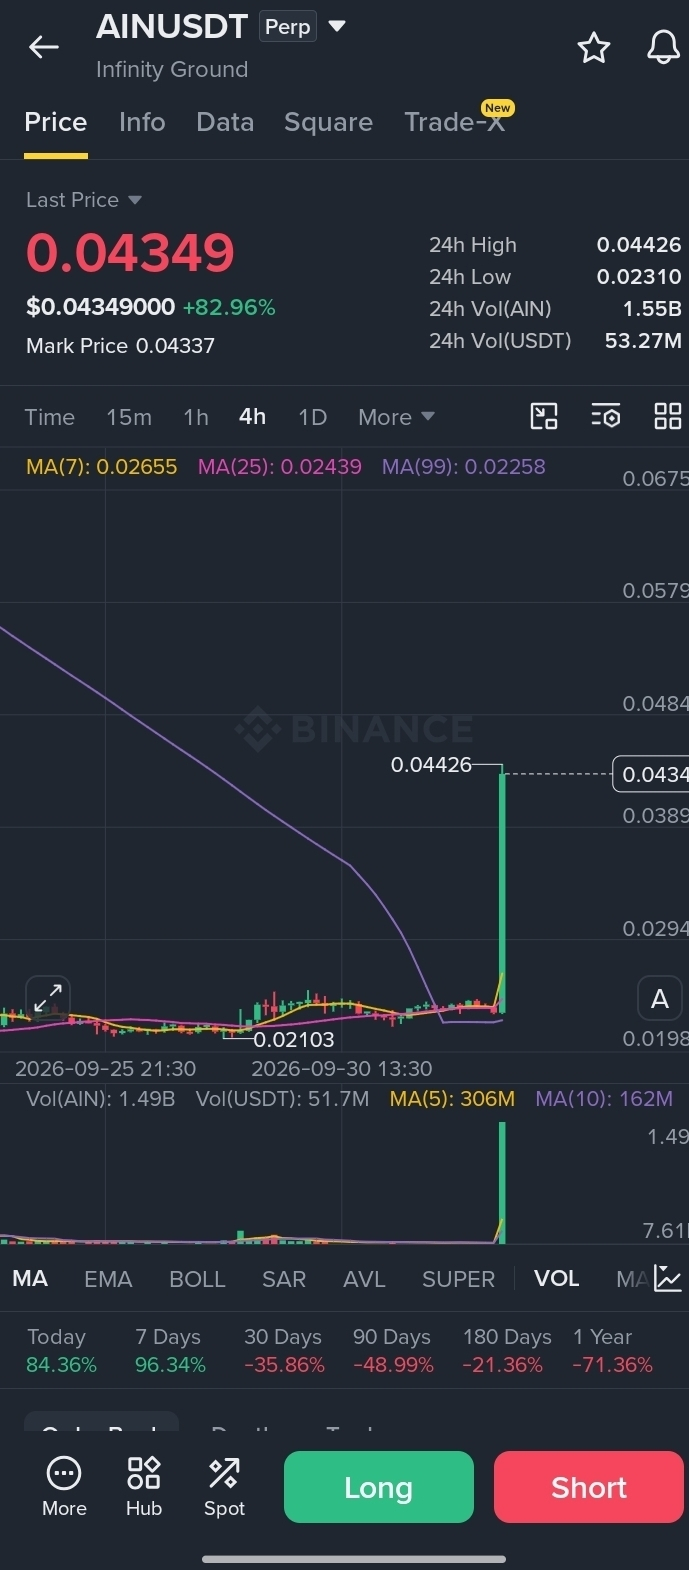
AIN/USDT has suddenly attracted strong market attention after a powerful move on the 4H chart. 📈
At the time of the chart snapshot:
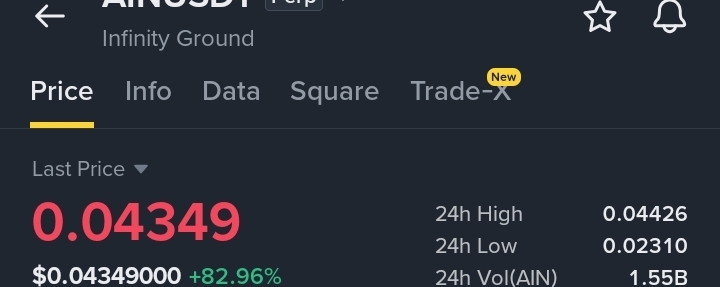
💰 Price: $0.04349
📈 24H Change: +82.96%
🔺 24H High: $0.04426
🔻 24H Low: $0.02310
📊 24H Volume: ~$53.27M USDT
One of the biggest things standing out is the massive volume spike accompanying the price move. 🚀 This suggests that market activity has increased significantly compared with the previous candles.
The 4H chart also shows price moving far above the recent consolidation area around $0.02–$0.03, creating a very strong breakout-style move.
⚠️ However, after such a rapid increase, volatility can be extremely high. Traders should watch how price behaves around the recent high and whether the market can maintain the momentum.
👀 Key levels to watch:
🔹 $0.04426 — recent high
🔹 $0.0435 — current area
🔹 $0.039 — nearby psychological/technical area
🔹 $0.029–$0.030 — previous breakout region
📌 Remember: A huge green candle doesn't automatically mean price will continue straight up. Confirmation, volume, and risk management are important.
🔥 AIN/USDT is definitely a pair worth watching right now.