$BTC Different Liquidation Data! WHERE IS IT HEADED?
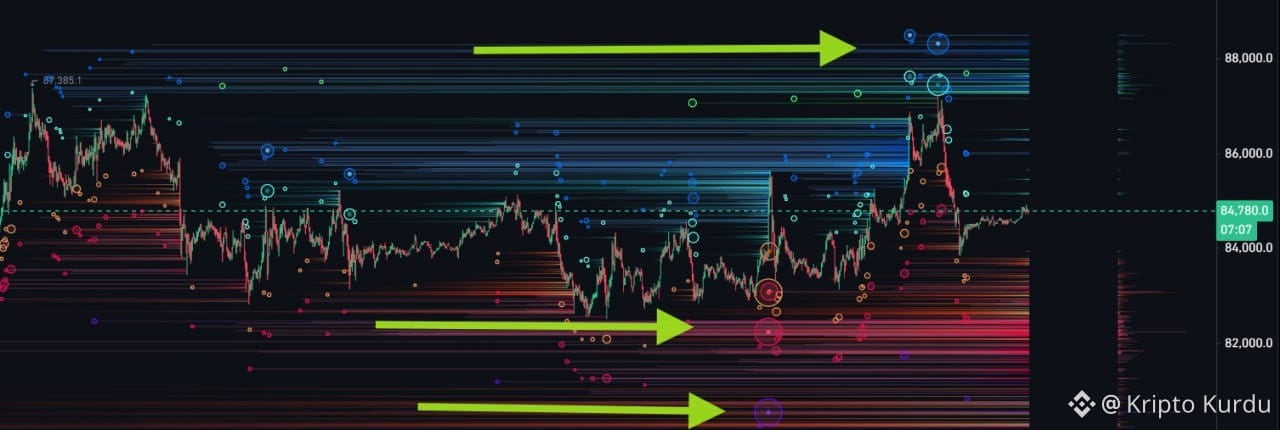
Let’s analyze this data, called “bubble liquidation,” for #Bitcoin . This chart will focus on a slightly shorter timeframe. In other words, we’ll be looking at the next 1–2 days.
Looking at the bubbles, we see two zones below and one zone above. In fact, the price has started to move in a slightly bearish pattern in the short term. So, these zones could break first.
Once these two bubbles burst, the lower section will become more stable. This stabilization could make the upward movement more consistent.
When I look at the higher time frames (HTF), the picture is still bullish, but such pullbacks are quite likely in the short term. We’re in a zone where everyone is trying to determine the direction. Liquidations won’t be avoided.
So, manage your leverage and risk very carefully. DYOR!
Let’s analyze this data, called “bubble liquidation,” for #Bitcoin . This chart will focus on a slightly shorter timeframe. In other words, we’ll be looking at the next 1–2 days.
Looking at the bubbles, we see two zones below and one zone above. In fact, the price has started to move in a slightly bearish pattern in the short term. So, these zones could break first.
Once these two bubbles burst, the lower section will become more stable. This stabilization could make the upward movement more consistent.
When I look at the higher time frames (HTF), the picture is still bullish, but such pullbacks are quite likely in the short term. We’re in a zone where everyone is trying to determine the direction. Liquidations won’t be avoided.
So, manage your leverage and risk very carefully. DYOR!