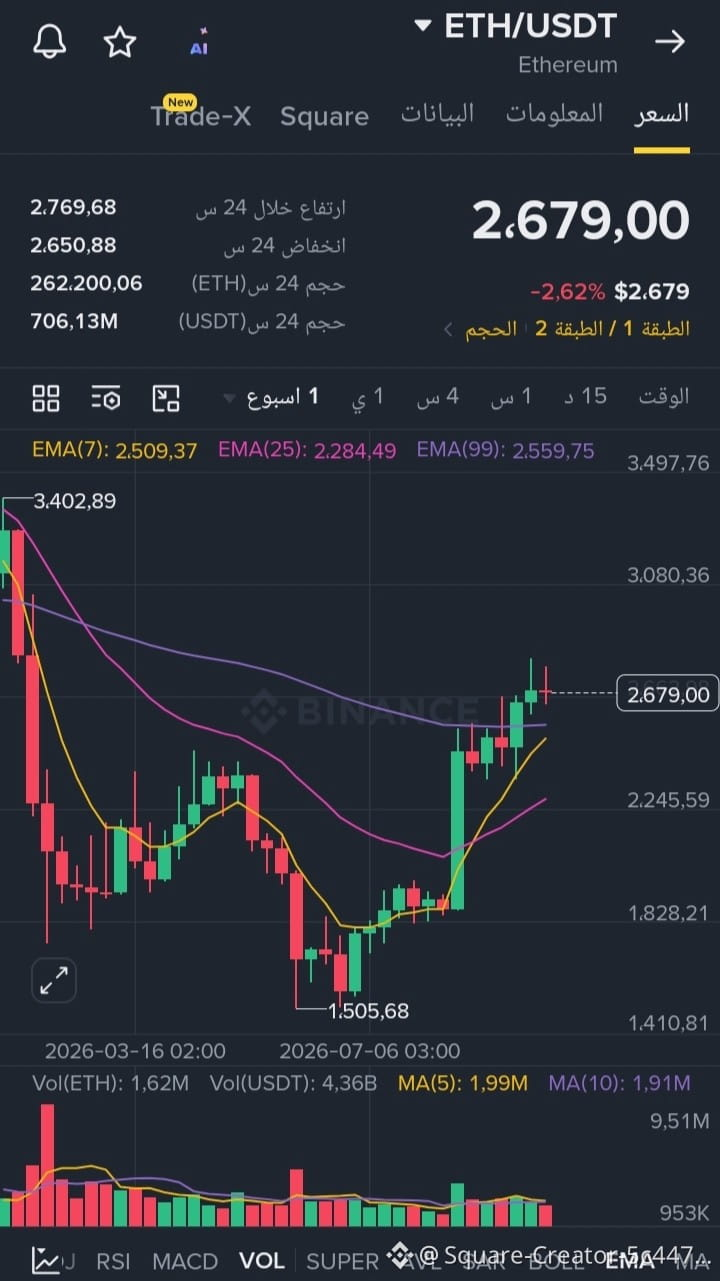
Here is a brief technical analysis of pair $ETH based on the chart:
⚡Overall trend: The price is currently in an upward trend on the weekly timeframe after a strong rebound from the 1,505.68 USD bottom and breaking above the positive moving averages.
🚀Moving averages (EMA): The price (2,679.00$) is trading above the moving averages (EMA 7 at 2,509, EMA 25 at 2,284, and EMA 99 at 2,559), which supports the continuation of the bullish momentum.
💰Resistance levels: The next nearby resistance is at the high of the past 24 hours at 2,769.68$; following it is a stronger resistance level at 3,080.36$.
Support levels: The 2,559$ level (EMA 99) forms an important first support zone, followed by the main support at 2,509$ to help ensure the continuation of the upward momentum.
#USRussiaUkraineTalksReportedlyIncludeLukoilOilDeal
⚡Overall trend: The price is currently in an upward trend on the weekly timeframe after a strong rebound from the 1,505.68 USD bottom and breaking above the positive moving averages.
🚀Moving averages (EMA): The price (2,679.00$) is trading above the moving averages (EMA 7 at 2,509, EMA 25 at 2,284, and EMA 99 at 2,559), which supports the continuation of the bullish momentum.
💰Resistance levels: The next nearby resistance is at the high of the past 24 hours at 2,769.68$; following it is a stronger resistance level at 3,080.36$.
Support levels: The 2,559$ level (EMA 99) forms an important first support zone, followed by the main support at 2,509$ to help ensure the continuation of the upward momentum.
#USRussiaUkraineTalksReportedlyIncludeLukoilOilDeal