#QNT ĐỈNH CAO HAY VỰC SÂU? — EVERYTHING IS TRENDING
QNT is standing right at a fairly sensitive technical area.
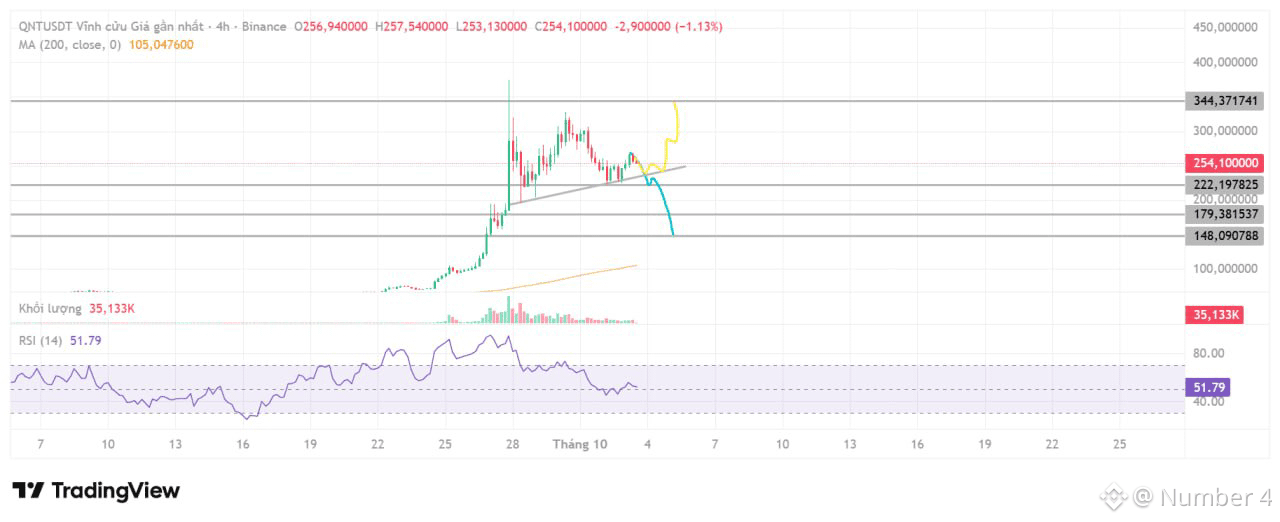
On the 4H chart, the most important thing I’m paying attention to right now is not the RSI or a single candle, but the rising trendline that is holding up the entire current price structure.
📌 Scenario 1 — Hold the trendline
If QNT continues to adhere to and responds positively at the trendline, the short-term bullish structure is still intact.
Then, the market may see a stop hunt / liquidity sweep above, with an initial target upward toward:
🎯 344
This is a major resistance zone on the chart, and it’s also an area worth watching if the price truly breaks out of the current accumulation zone.
📌 Scenario 2 — Break the trendline
If the trendline is clearly broken, the story changes.
The first reaction zone I’m watching is:
⚠️ 179 — the 0.618 Fibonacci confluence area
This is a notable support area. If the price drops here and shows a strong reaction, QNT still has a chance to form a rebound.
On the other hand, if 179 is also strongly breached, the structure will become worse—and then we need to expand the observation zone downward to the supports below—just like the scenario I marked on the chart, around 148 and lower areas depending on the price’s real reaction.
In simple terms:
Hold the trendline → there’s still a path toward 344.
Break the trendline → watch 179.
Lose 179 → start the farther scenario.
The most important point: these are only technical scenarios based on the current structure, not a certain prediction of the price. The market can change completely when large volume appears, on a breakout/breakdown, or when new data comes in.
Guys who are holding QNT— which zone are you watching as the most important? #BinanceSquare #technical_analysis #QNTUSDT
QNT is standing right at a fairly sensitive technical area.
On the 4H chart, the most important thing I’m paying attention to right now is not the RSI or a single candle, but the rising trendline that is holding up the entire current price structure.
📌 Scenario 1 — Hold the trendline
If QNT continues to adhere to and responds positively at the trendline, the short-term bullish structure is still intact.
Then, the market may see a stop hunt / liquidity sweep above, with an initial target upward toward:
🎯 344
This is a major resistance zone on the chart, and it’s also an area worth watching if the price truly breaks out of the current accumulation zone.
📌 Scenario 2 — Break the trendline
If the trendline is clearly broken, the story changes.
The first reaction zone I’m watching is:
⚠️ 179 — the 0.618 Fibonacci confluence area
This is a notable support area. If the price drops here and shows a strong reaction, QNT still has a chance to form a rebound.
On the other hand, if 179 is also strongly breached, the structure will become worse—and then we need to expand the observation zone downward to the supports below—just like the scenario I marked on the chart, around 148 and lower areas depending on the price’s real reaction.
In simple terms:
Hold the trendline → there’s still a path toward 344.
Break the trendline → watch 179.
Lose 179 → start the farther scenario.
The most important point: these are only technical scenarios based on the current structure, not a certain prediction of the price. The market can change completely when large volume appears, on a breakout/breakdown, or when new data comes in.
Guys who are holding QNT— which zone are you watching as the most important? #BinanceSquare #technical_analysis #QNTUSDT