🔥 Is the market maker preparing to tighten the belt and launch $LUNC ... or is it just another liquidity trap? 🎯💥
Fear is taking over the scene after the last drop, but reading the chart reveals other details! 👀
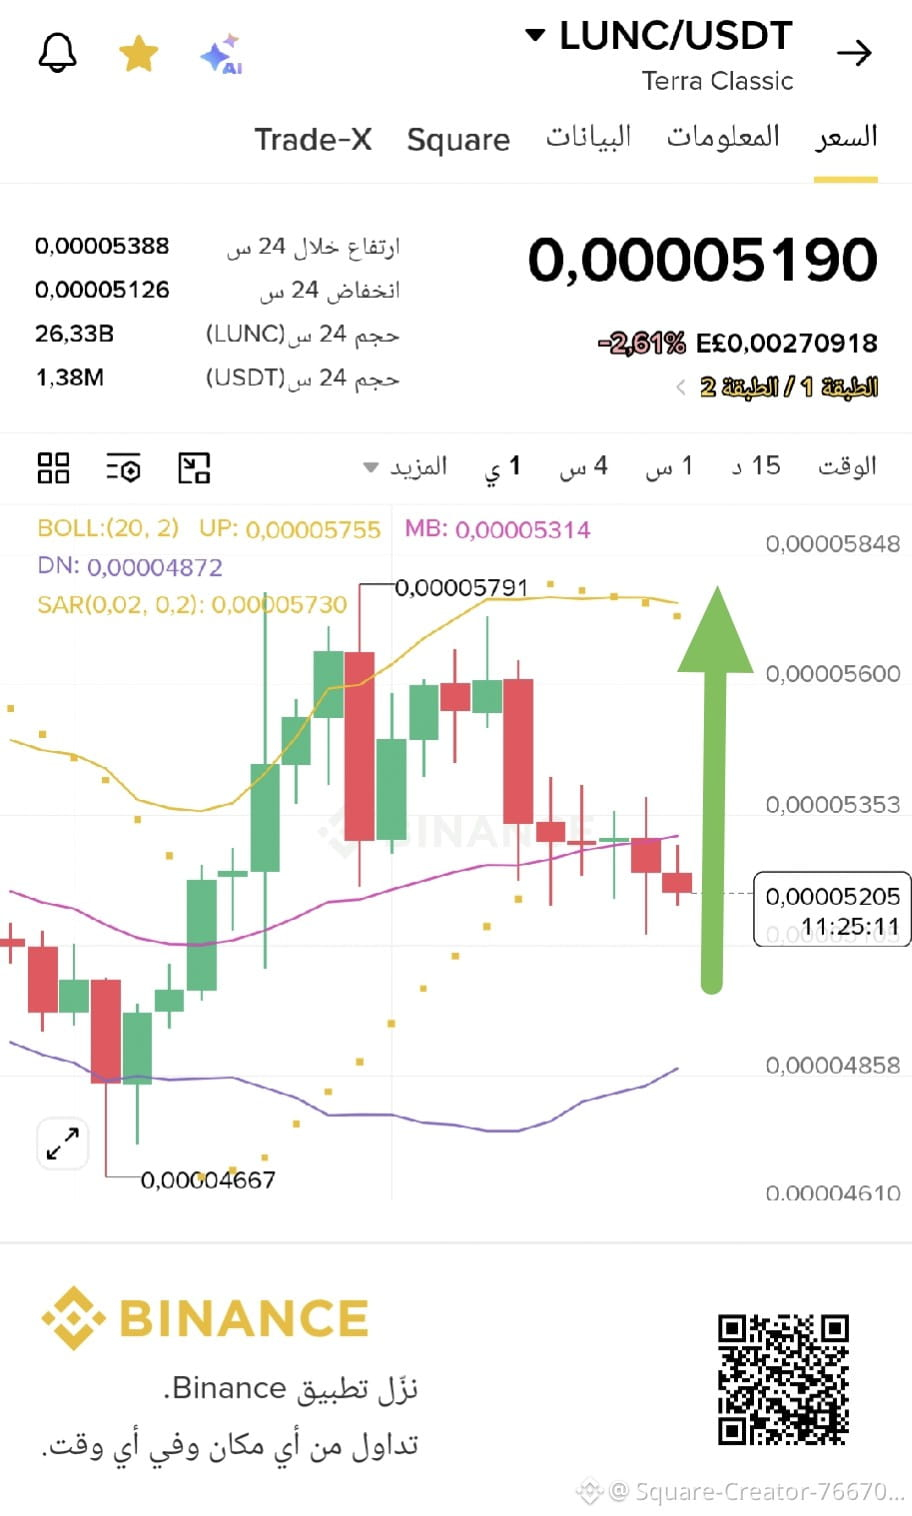
LUNC is currently trading at 0.00005190 USDT with a slight sell pressure of -2.61%, after successfully rebounding from a low of 0.00004667 USDT up to a peak of 0.00005791 USDT, and then entering a local corrective range.
While some interpret the red candles as an exit signal, technical indicators suggest a smart money re-accumulation scenario to absorb panic selling and prepare liquidity for the next wave! 📉➡️📈
🔍 The technical map and decisive levels on the 15-minute chart:
* 🟢 Structural breakout scenario: Holding the price above the lower Bollinger Band support (DN: 0.00004872) and breaking above the midline (MB: 0.00005314) clears the way directly to target the previous high at 0.00005755 USDT, paving the path for a price surge toward 0.00006200+ USDT.
* 🔴 Support break scenario: Any further drop that breaks the support aims only to liquidate futures contracts and test the low at 0.00004667 before determining the final direction.
💡 Trading strategy: Risk management is the key; accumulating at rebound levels provides an excellent price advantage before a bullish confirmation.
What do you think about LUNC’s next move? Are we at the start of a strong upward wave, or will it continue to trade sideways? Share your views and analyses in the comments! 👇
#LUNC #CryptoNews
#BinanceSquare
#TradingAlert
NFA. DYOR.
Fear is taking over the scene after the last drop, but reading the chart reveals other details! 👀
LUNC is currently trading at 0.00005190 USDT with a slight sell pressure of -2.61%, after successfully rebounding from a low of 0.00004667 USDT up to a peak of 0.00005791 USDT, and then entering a local corrective range.
While some interpret the red candles as an exit signal, technical indicators suggest a smart money re-accumulation scenario to absorb panic selling and prepare liquidity for the next wave! 📉➡️📈
🔍 The technical map and decisive levels on the 15-minute chart:
* 🟢 Structural breakout scenario: Holding the price above the lower Bollinger Band support (DN: 0.00004872) and breaking above the midline (MB: 0.00005314) clears the way directly to target the previous high at 0.00005755 USDT, paving the path for a price surge toward 0.00006200+ USDT.
* 🔴 Support break scenario: Any further drop that breaks the support aims only to liquidate futures contracts and test the low at 0.00004667 before determining the final direction.
💡 Trading strategy: Risk management is the key; accumulating at rebound levels provides an excellent price advantage before a bullish confirmation.
What do you think about LUNC’s next move? Are we at the start of a strong upward wave, or will it continue to trade sideways? Share your views and analyses in the comments! 👇
#LUNC #CryptoNews
#BinanceSquare
#TradingAlert
NFA. DYOR.