$FIL has been absolutely destroyed.
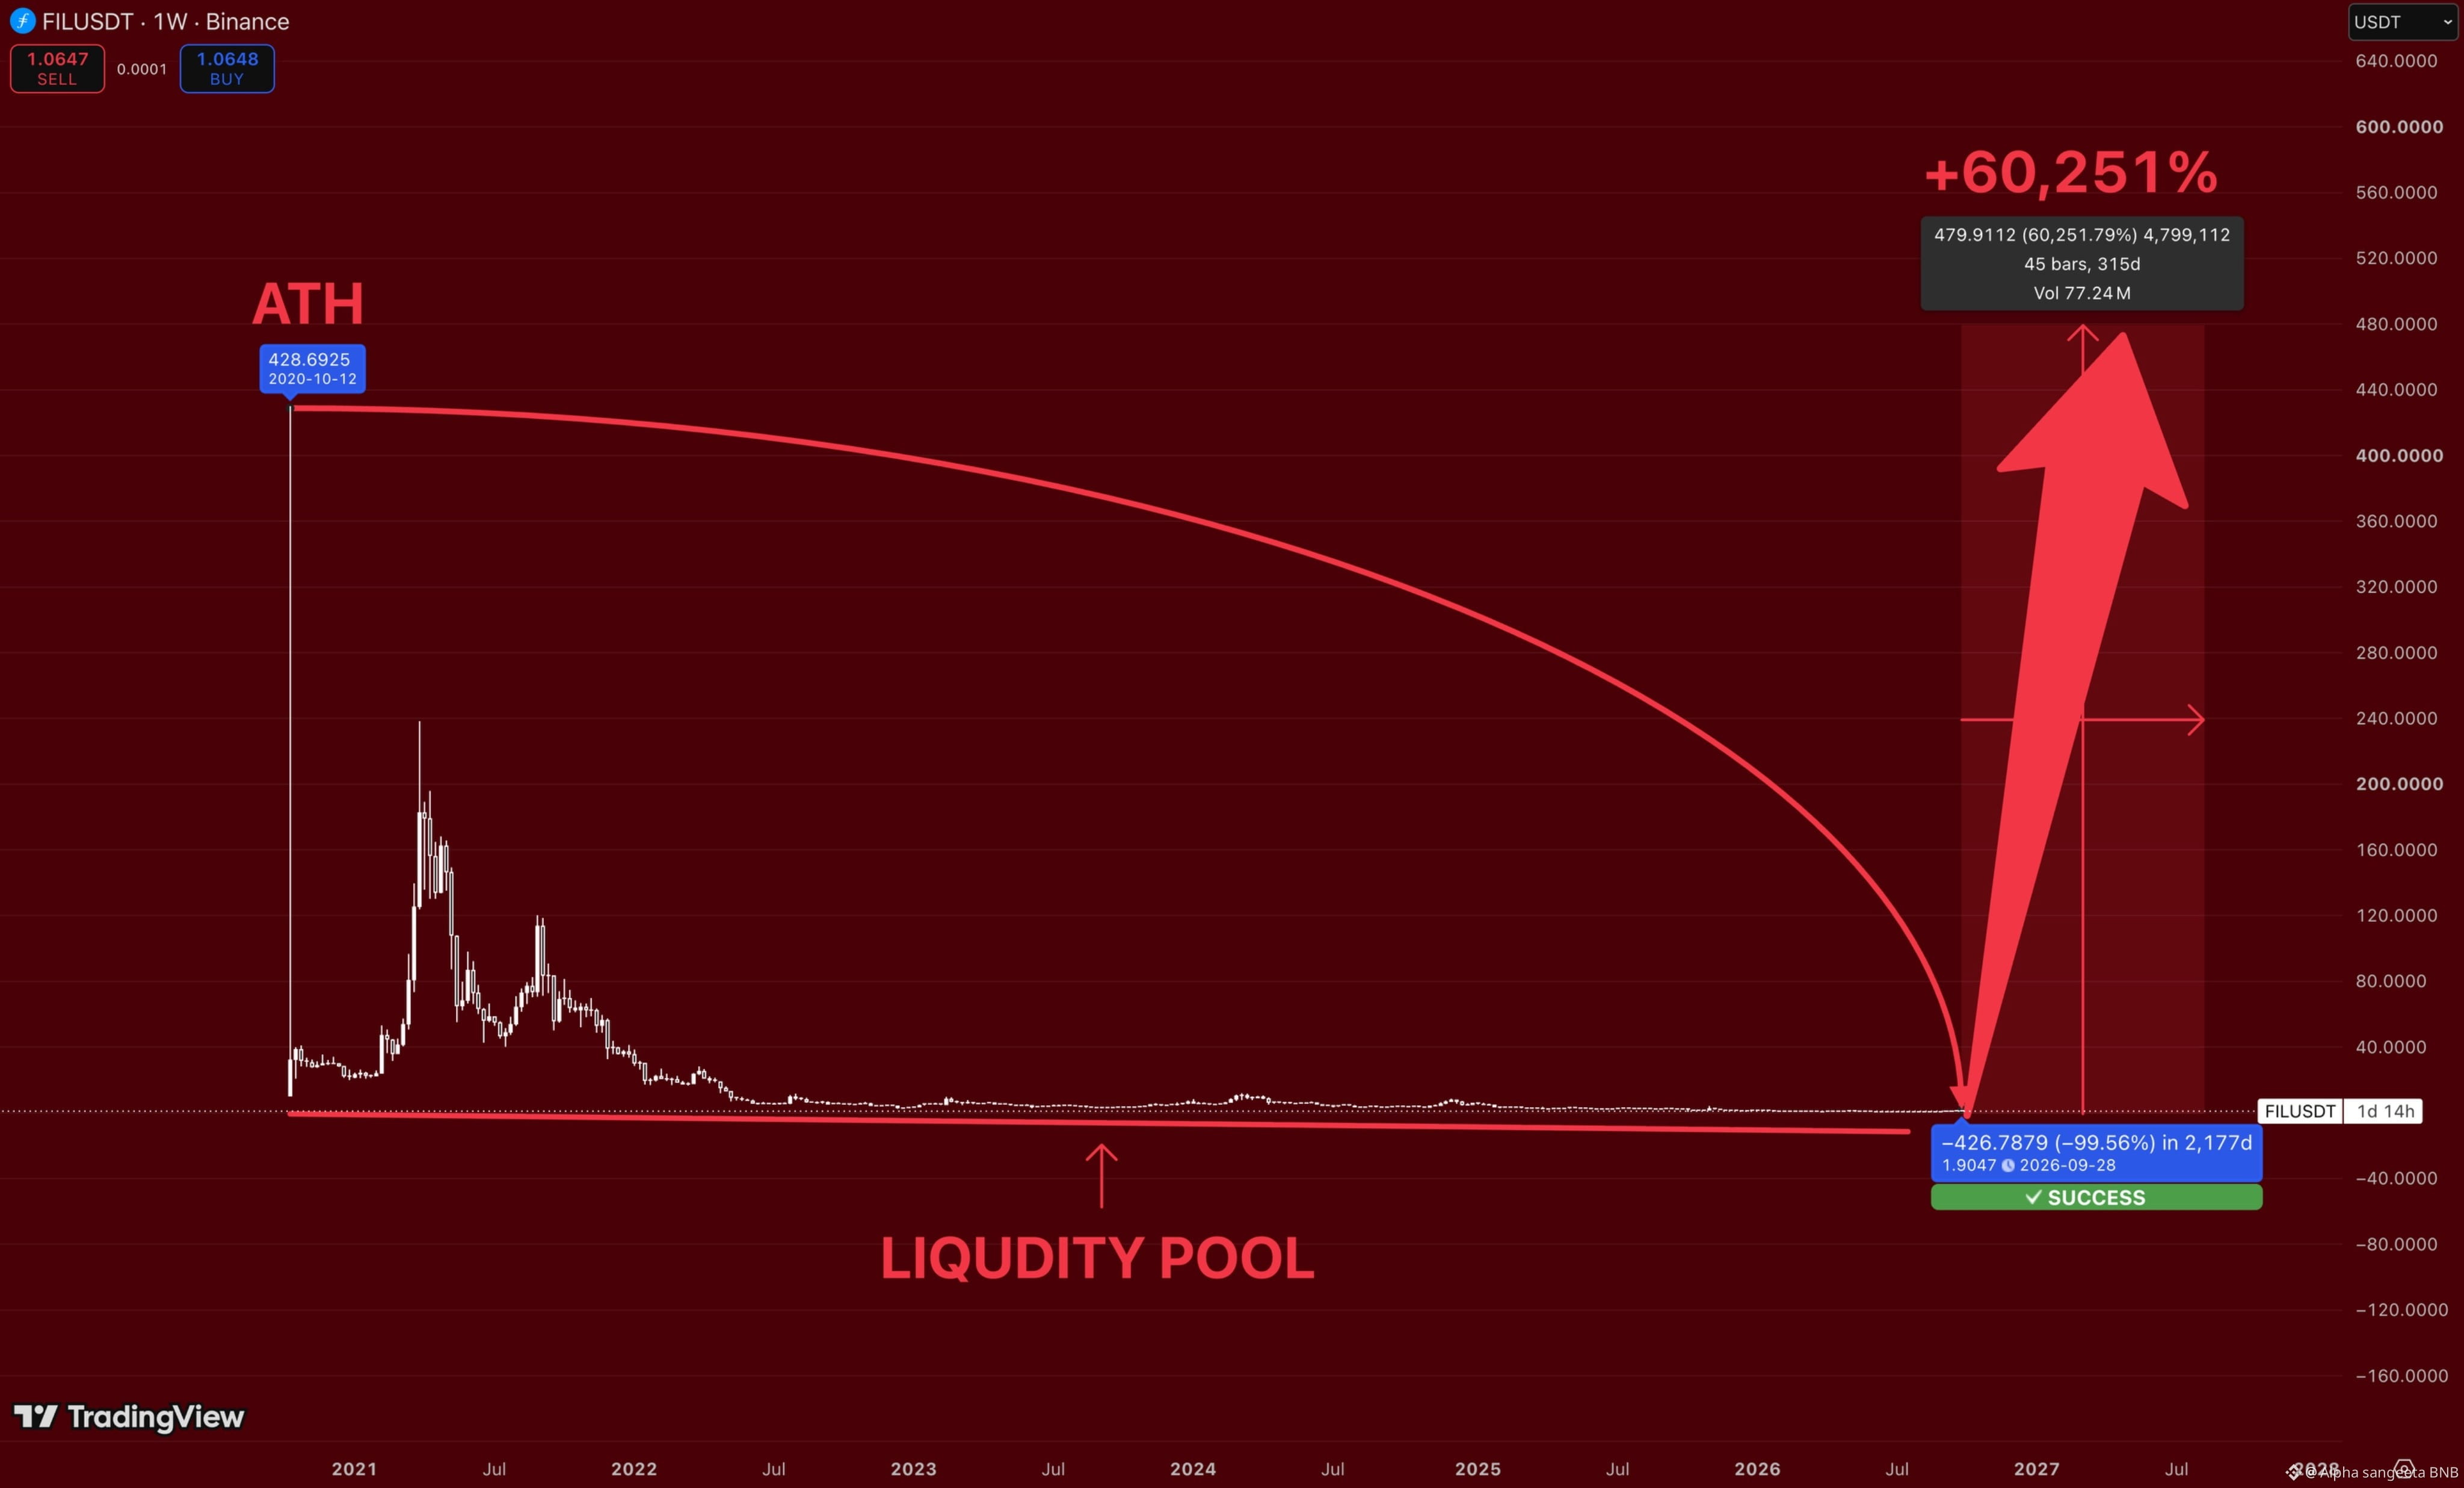
From $428 ATH to around $1.
That’s basically a 99% collapse.
And this is exactly why the chart is interesting to me now.
$FIL has spent years bleeding
while price is sitting right on the same massive liquidity area.
Almost nobody wants to touch it here.
But if this zone becomes the bottom and $FIL finally enters an expansion phase…
The upside gets stupid very quickly.
The scenario on my chart shows +60,000% from the lows.
Sounds insane.
So did at $400 when it was trading near $1.
From $428 ATH to around $1.
That’s basically a 99% collapse.
And this is exactly why the chart is interesting to me now.
$FIL has spent years bleeding
while price is sitting right on the same massive liquidity area.
Almost nobody wants to touch it here.
But if this zone becomes the bottom and $FIL finally enters an expansion phase…
The upside gets stupid very quickly.
The scenario on my chart shows +60,000% from the lows.
Sounds insane.
So did at $400 when it was trading near $1.