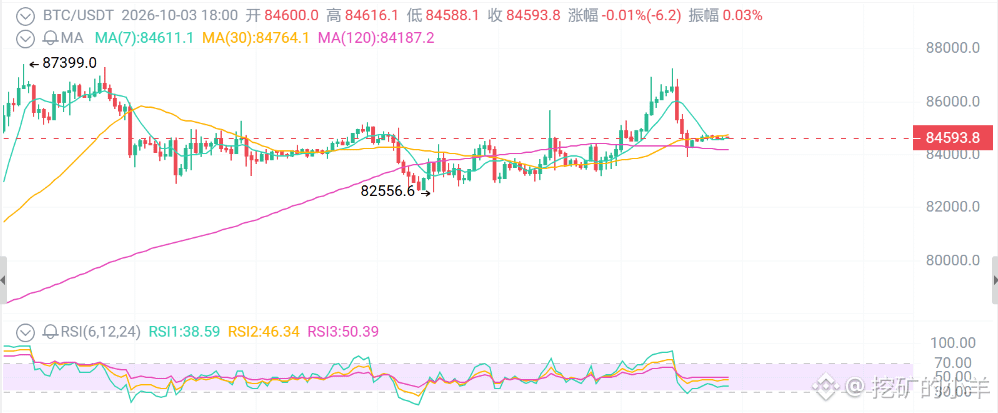
$84,600 BTC—do you want to buy it?
First, look at the surface: In September, Nonfarm Payrolls only rose by 29k vs. an 80k–90k expectation, unemployment rate climbed to 4.2%, and wage growth also slowed. After the data came out, the probability of a rate hike in October dropped from 64% to 20%, and BTC immediately crashed to 87,220. Then what? The 10-year U.S. Treasury yield rebounded from 5.16% to 5.27%. December still has rate-hike pricing. Risk assets gave back, and BTC returned to 84,600.
First thing: ETF inflows are cooling, but Citi says 113k.
Spot ETFs are the core buy-side that pulled price back from 65k, but after the September peak, inflows clearly slowed—so pushing toward 87k can’t be sustained.
However, Citi raised its 12-month target from 82k to 113k, citing a recovery in ETF inflows plus the fiscal deficit narrative.
No ammunition in the short term, but a story in the medium term. If you trade based on short-term volatility, don’t use long-term narratives to give yourself courage.
Second thing: On-chain liquidation clusters—fuel on both sides.
Long and short liquidation clusters are concentrated at 83,500, 85,100, and 87,700. What does that mean? No matter which way the “dog traders” push, they can trigger a bunch of people getting liquidated.
So you’ll see price sweep back and forth between 83,000 and 87,200, with lots of “fake breakouts.”
Don’t guess direction in the middle of the range—that’s for gamblers.
Third thing: The technicals tell you this is a range, not the main selloff wave.
Daily: Price is above all major moving averages; 50-day > 200-day. RSI is 60–63—still strong, but already pulled back from overbought. Around the Bollinger midline, the upper band is 89k and the lower band is 76k.
4-hour: After topping at 87,220, it pulled back and is grinding inside a flag pattern between 83,000 and 87,200. The midline is 84,200—so today’s 84,600 is right around slightly above the center axis.
Key levels:
Resistance: 85,200 → 86,500–86,800 → 87,220–87,700
Support: 84,200–84,000 → 83,100–83,500 → 82,000 → 80,000
A daily close below 84,000 only weakens things; only a valid breakdown of 82,000 would change the structure from “high-level consolidation” to a “deeper retracement.”
Trading strategy
Range trading: take profits into strength and buy dips.
At 84,600 (the middle of the range), the risk-reward is mediocre—don’t chase. If price retraces from 86,500–87,200 and meets resistance, and the 4-hour chart can’t reclaim that level, short with a small position: stop-loss above 87,800, targets 84,200 / 83,500.
If it falls into 83,500–83,100 and you see a reversal with long lower wicks, then go long in batches, stop-loss below 82,800, targets 85,200 / 86,500.
Breakout trades:
Only if the 4-hour close holds above 87,220 and volume expands, then look for 88,500–89,000; stop-loss is a close back below 86,500.
If the daily close breaks below 83,100 and can’t reclaim it, move the short targets down to 82,000 / 80,000.
First, look at the surface: In September, Nonfarm Payrolls only rose by 29k vs. an 80k–90k expectation, unemployment rate climbed to 4.2%, and wage growth also slowed. After the data came out, the probability of a rate hike in October dropped from 64% to 20%, and BTC immediately crashed to 87,220. Then what? The 10-year U.S. Treasury yield rebounded from 5.16% to 5.27%. December still has rate-hike pricing. Risk assets gave back, and BTC returned to 84,600.
First thing: ETF inflows are cooling, but Citi says 113k.
Spot ETFs are the core buy-side that pulled price back from 65k, but after the September peak, inflows clearly slowed—so pushing toward 87k can’t be sustained.
However, Citi raised its 12-month target from 82k to 113k, citing a recovery in ETF inflows plus the fiscal deficit narrative.
No ammunition in the short term, but a story in the medium term. If you trade based on short-term volatility, don’t use long-term narratives to give yourself courage.
Second thing: On-chain liquidation clusters—fuel on both sides.
Long and short liquidation clusters are concentrated at 83,500, 85,100, and 87,700. What does that mean? No matter which way the “dog traders” push, they can trigger a bunch of people getting liquidated.
So you’ll see price sweep back and forth between 83,000 and 87,200, with lots of “fake breakouts.”
Don’t guess direction in the middle of the range—that’s for gamblers.
Third thing: The technicals tell you this is a range, not the main selloff wave.
Daily: Price is above all major moving averages; 50-day > 200-day. RSI is 60–63—still strong, but already pulled back from overbought. Around the Bollinger midline, the upper band is 89k and the lower band is 76k.
4-hour: After topping at 87,220, it pulled back and is grinding inside a flag pattern between 83,000 and 87,200. The midline is 84,200—so today’s 84,600 is right around slightly above the center axis.
Key levels:
Resistance: 85,200 → 86,500–86,800 → 87,220–87,700
Support: 84,200–84,000 → 83,100–83,500 → 82,000 → 80,000
A daily close below 84,000 only weakens things; only a valid breakdown of 82,000 would change the structure from “high-level consolidation” to a “deeper retracement.”
Trading strategy
Range trading: take profits into strength and buy dips.
At 84,600 (the middle of the range), the risk-reward is mediocre—don’t chase. If price retraces from 86,500–87,200 and meets resistance, and the 4-hour chart can’t reclaim that level, short with a small position: stop-loss above 87,800, targets 84,200 / 83,500.
If it falls into 83,500–83,100 and you see a reversal with long lower wicks, then go long in batches, stop-loss below 82,800, targets 85,200 / 86,500.
Breakout trades:
Only if the 4-hour close holds above 87,220 and volume expands, then look for 88,500–89,000; stop-loss is a close back below 86,500.
If the daily close breaks below 83,100 and can’t reclaim it, move the short targets down to 82,000 / 80,000.