$BR /$US /$ATOM 30 for 4 hours all bearish, multi-cycle resonance🔥
════════════════════
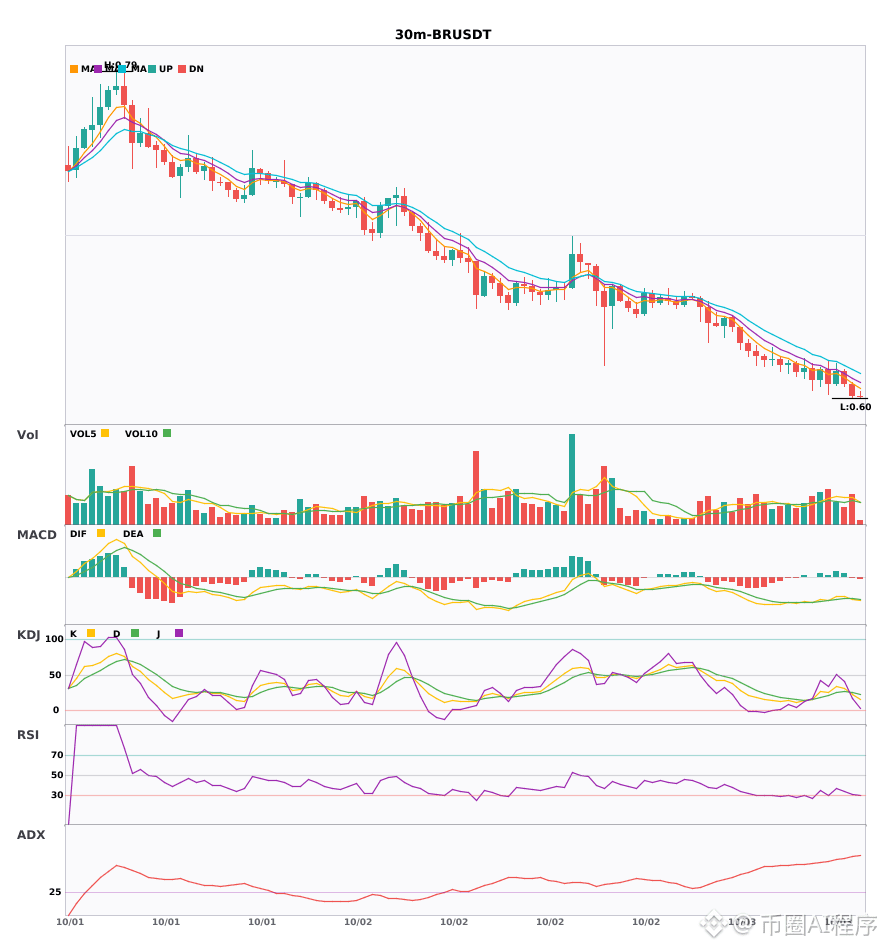
🟢 $BR 30-minute bearish signal
⚠️ Technical analysis: 30-minute MACD forms a dead cross below zero, green histogram bars expand, moving averages are arranged bearishly and diverge downward; KDJ forms a dead cross but has not been oversold. 4-hour bearish in the same direction resonates and confirms; short-term outlook is bearish.
════════════════════
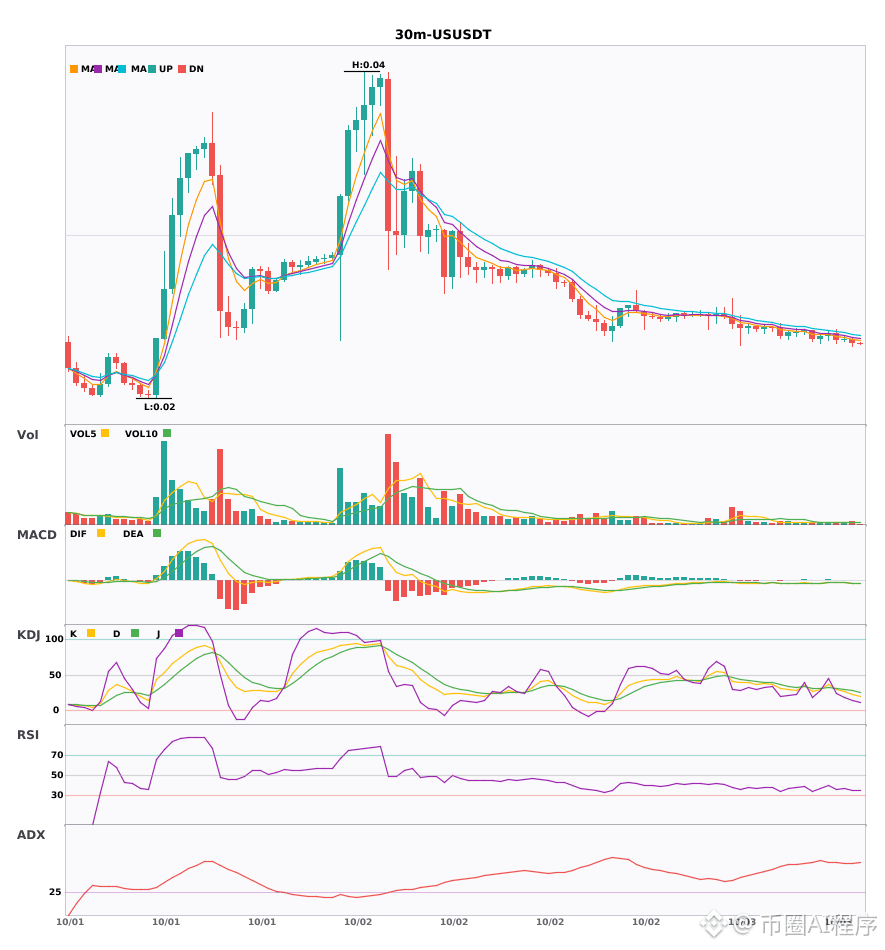
🟢 $US 30-minute bearish signal
⚠️ Technical analysis: Enter on the 30-minute chart; 4-hour bearish resonance confirms. After the MACD dead cross, green histogram bars expand, moving averages are arranged bearishly and diverge downward; KDJ K crosses below D but has not been oversold. Volume increases by 1.3x.
════════════════════
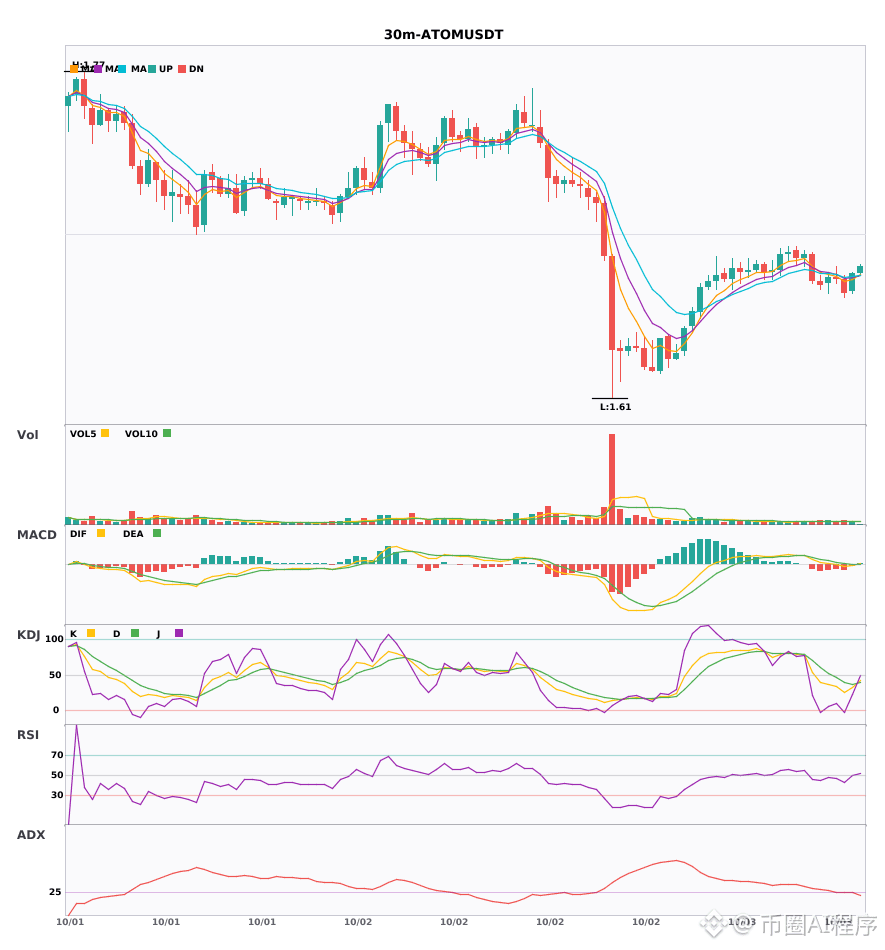
🟢 $ATOM 30-minute bearish signal
⚠️ Technical analysis: 4-hour bearish + 30-minute bearish resonance confirmation. MACD green histogram continues to expand, moving averages are arranged bearishly and diverge downward. KDJ K crosses below D and has not been oversold; volume is normal but slightly strong.
════════════════════
🔔 Follow to get the first-hand market changes 🔔
#多周期共振 #BR #US #ATOM
📌 When trading, pay attention to whether the candlestick pattern matches
════════════════════
🟢 $BR 30-minute bearish signal
⚠️ Technical analysis: 30-minute MACD forms a dead cross below zero, green histogram bars expand, moving averages are arranged bearishly and diverge downward; KDJ forms a dead cross but has not been oversold. 4-hour bearish in the same direction resonates and confirms; short-term outlook is bearish.
════════════════════
🟢 $US 30-minute bearish signal
⚠️ Technical analysis: Enter on the 30-minute chart; 4-hour bearish resonance confirms. After the MACD dead cross, green histogram bars expand, moving averages are arranged bearishly and diverge downward; KDJ K crosses below D but has not been oversold. Volume increases by 1.3x.
════════════════════
🟢 $ATOM 30-minute bearish signal
⚠️ Technical analysis: 4-hour bearish + 30-minute bearish resonance confirmation. MACD green histogram continues to expand, moving averages are arranged bearishly and diverge downward. KDJ K crosses below D and has not been oversold; volume is normal but slightly strong.
════════════════════
🔔 Follow to get the first-hand market changes 🔔
#多周期共振 #BR #US #ATOM
📌 When trading, pay attention to whether the candlestick pattern matches