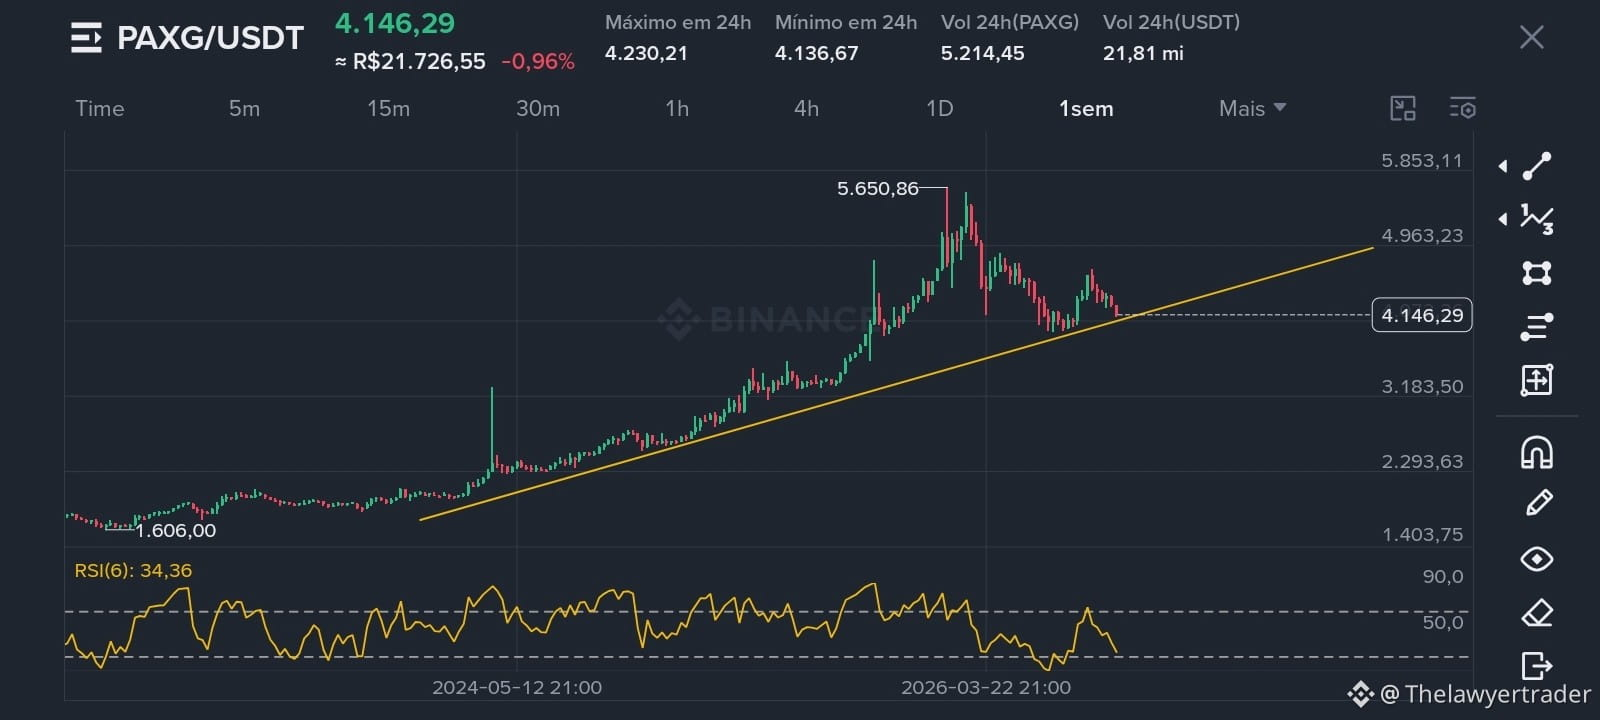
PAXG/USDT Analysis — Weekly Chart
General context:
PAXG (tokenized gold) is following a long-term uptrend, but it is currently in a correction phase. The current price is trading around 4,146, well below the recent high of 5,650, which indicates a loss of momentum in the short term.
Visible chart pattern:
The asset is testing an ascending support line (the main uptrend). This is the key point right now: the price is exactly on this support, in a decision zone.
Probability (chart analysis):
Bull continuation scenario (~60%): if the ascending support holds, it is reasonable to expect a rebound toward the prior highs, with RSI(6) at 34.36 indicating room for recovery (the asset is near oversold, without being overbought).
Bear reversal/consolidation scenario (~40%): a weekly close below this support line would weaken the structure, opening the way for sideways movement or a bearish phase.
Indicator:
RSI(6) at 34.36 — below the midline (50), signaling temporary weakness, but without being overbought, which historically favors a search for support.
Conclusion:
Support at the yellow line is the determining factor. As long as it is not broken, the uptrend remains technically valid; a breakout below it changes the outlook toward consolidation.
⚠️ Exclusively technical and educational analysis, not investment advice. Cryptoassets are volatile; do your own research.
#PAXGUSDT $PAXG
General context:
PAXG (tokenized gold) is following a long-term uptrend, but it is currently in a correction phase. The current price is trading around 4,146, well below the recent high of 5,650, which indicates a loss of momentum in the short term.
Visible chart pattern:
The asset is testing an ascending support line (the main uptrend). This is the key point right now: the price is exactly on this support, in a decision zone.
Probability (chart analysis):
Bull continuation scenario (~60%): if the ascending support holds, it is reasonable to expect a rebound toward the prior highs, with RSI(6) at 34.36 indicating room for recovery (the asset is near oversold, without being overbought).
Bear reversal/consolidation scenario (~40%): a weekly close below this support line would weaken the structure, opening the way for sideways movement or a bearish phase.
Indicator:
RSI(6) at 34.36 — below the midline (50), signaling temporary weakness, but without being overbought, which historically favors a search for support.
Conclusion:
Support at the yellow line is the determining factor. As long as it is not broken, the uptrend remains technically valid; a breakout below it changes the outlook toward consolidation.
⚠️ Exclusively technical and educational analysis, not investment advice. Cryptoassets are volatile; do your own research.
#PAXGUSDT $PAXG