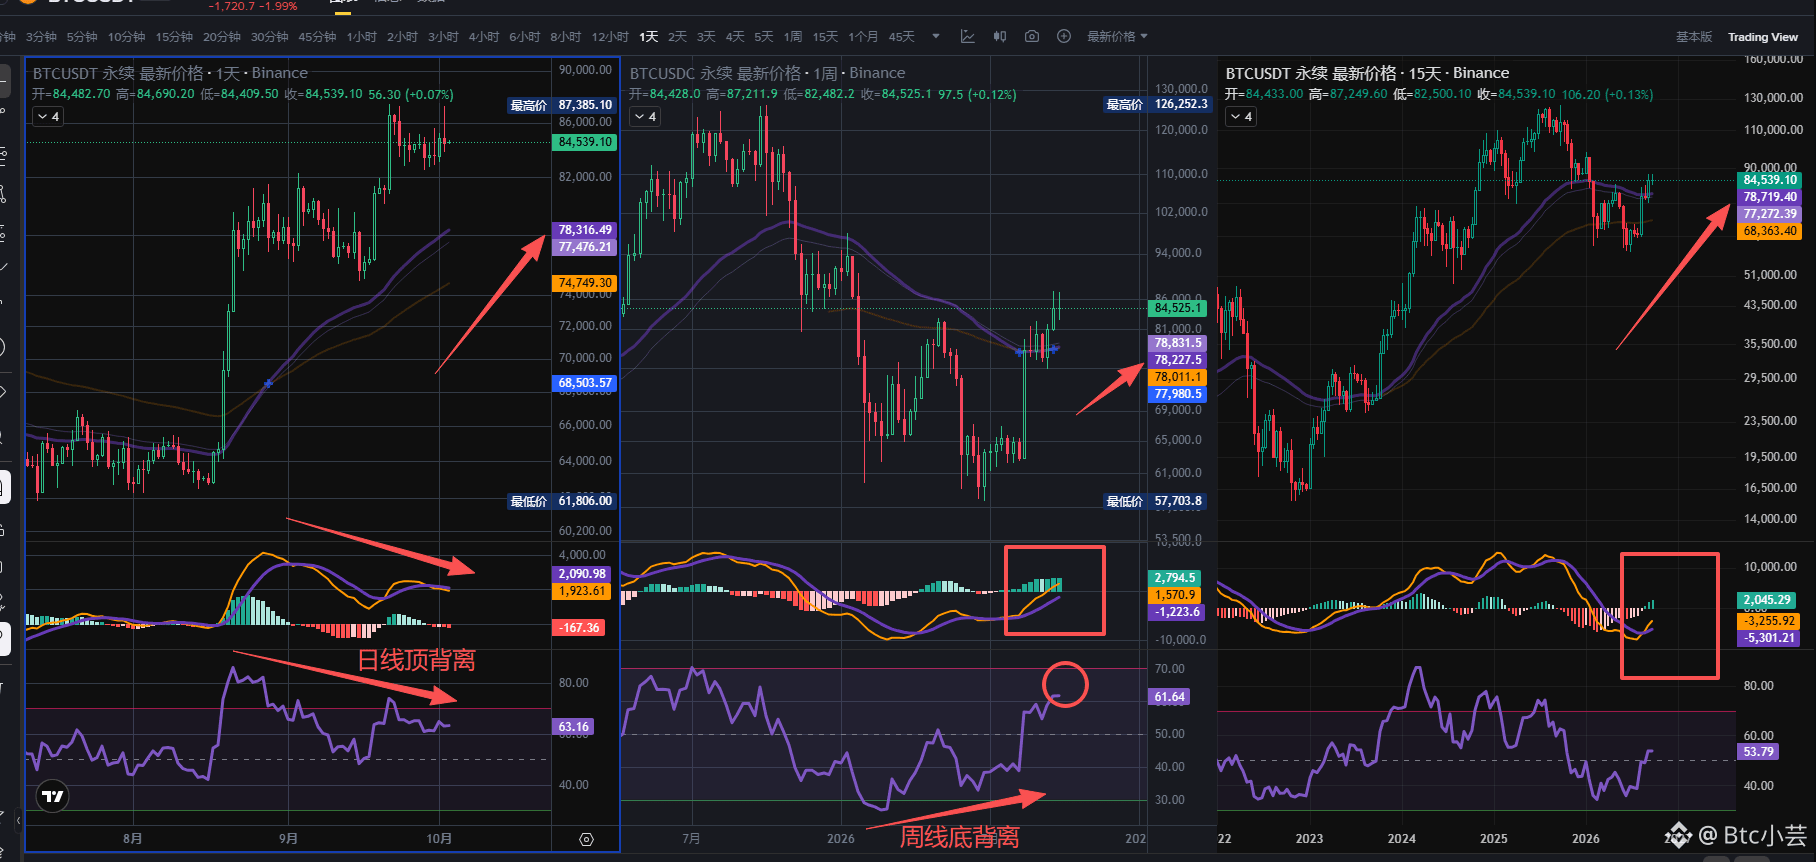
A single chart tells you how the orders are made. The chart shows three cycles: the daily chart, the weekly chart, and the 15-day chart. And the prices are all around 78. The daily chart has never adjusted from the beginning to the end. At the moment, the daily chart has a dual top divergence, which means there is a need for a pullback. The weekly chart is near an overbought level and has an upside demand. The RSI is also nearing the oversold zone. For now, I’m looking at 90,000 on the weekly chart. The 15-day timeframe is large; understand it as a range-bound consolidation. From this, you can reach this conclusion: the bull market is still early. It will keep swinging back and forth in a wide range of 78–90. 78 is just an indicator; it’s also possible that it breaks below, for example to 75. That means if you go long or short at 80,000, you won’t get trapped: $BTC