$SAND
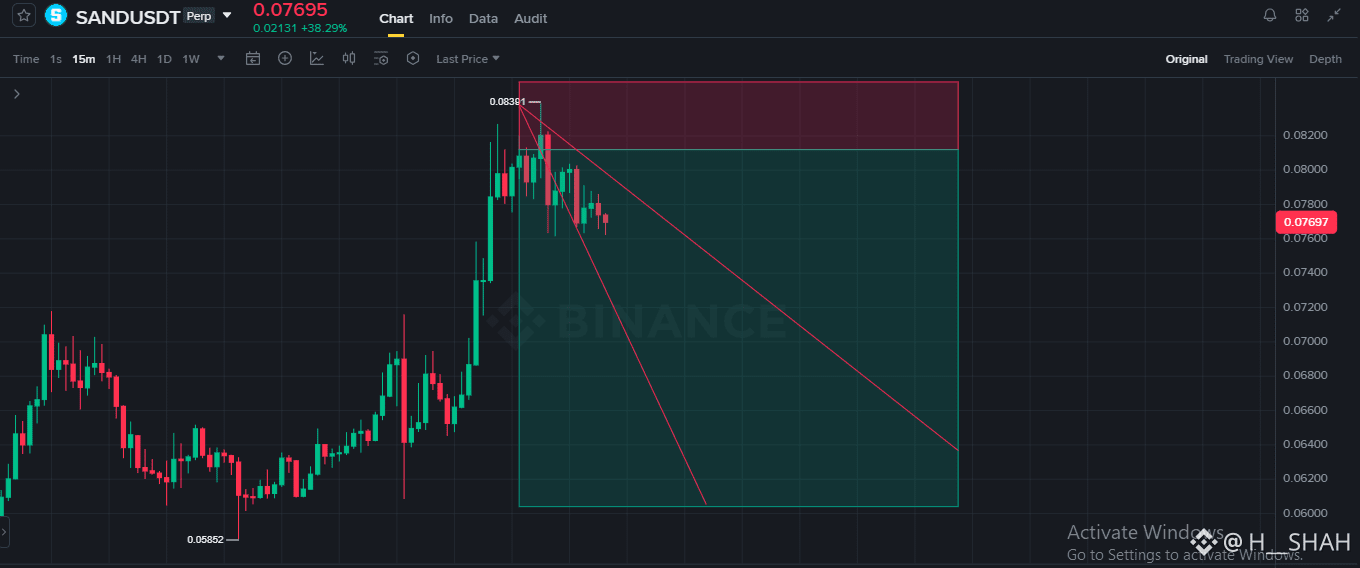
On the 15-minute timeframe chart for SAND/USDT, the market initially experienced a strong upward surge, climbing from a low of 0.05852 to a local high of 0.08391.
After encountering strong resistance and a sharp rejection at this peak, the price reversed its direction.
Currently, the market is in a short-term correction and downtrend phase, characterized by continuous lower highs and lower lows.
The trendlines and short position setup marked on the chart indicate that sellers are currently in control, keeping the price under downward pressure.
Unless the price successfully breaks above the 0.08391 resistance level, the short-term trend is expected to remain bearish (downtrend).
#downtrendsignal #strongsignalprovider #tradefast #10k
On the 15-minute timeframe chart for SAND/USDT, the market initially experienced a strong upward surge, climbing from a low of 0.05852 to a local high of 0.08391.
After encountering strong resistance and a sharp rejection at this peak, the price reversed its direction.
Currently, the market is in a short-term correction and downtrend phase, characterized by continuous lower highs and lower lows.
The trendlines and short position setup marked on the chart indicate that sellers are currently in control, keeping the price under downward pressure.
Unless the price successfully breaks above the 0.08391 resistance level, the short-term trend is expected to remain bearish (downtrend).
#downtrendsignal #strongsignalprovider #tradefast #10k