



When trading contracts, we usually first pay attention to market conditions, leverage, and fees. It’s easy to think that the quotes on the screen are the prices at which we can buy or sell.
When the order size is small, the two are often not very different.
When the position size increases and you need to close immediately, how much capital the order book can absorb will directly affect the final profit.
Liquidity can be understood like this: for an order of a specified amount, can it be completed quickly and executed at a price close to the market price at the time the order is placed.
Intuitively, the more orders you have and the thicker the order book, the better the execution conditions. However, real data often differs from this intuition: platforms ranking high in depth do not necessarily have the lowest slippage.
The September 2026 TokenInsight report offers one example: for combined BTC and ETH order book depth, MEXC led in the 0.03% price band, while Bitget led in the 0.05% band.
In the same report’s simulation of large BTC orders, Binance had lower slippage under less favorable execution conditions.
To understand this difference, we need to look at the distribution of limit orders, order processing, and changes in execution costs.
Another cost is hidden in the execution price
Fees are shown on the page; slippage is reflected in the average execution price. Paying more than the reference price when buying, or receiving less when selling, both add to your actual costs.
An order with a notional value of $100,000 incurs an extra $50 in costs for every 0.05% of additional slippage. If the same deviation occurs when both opening and closing a position, the total is $100.
Notional value refers to the trading value represented by a contract. Even if you put up only $10,000 in margin, a $50 cost on a single trade is equivalent to 0.5% of your margin.
For traders who frequently open and close positions, even small amounts of slippage accumulate over time. When choosing a platform, low execution costs and low fees should be equally important considerations.
Effective liquidity is about what you can execute
A depth chart records current limit orders and can help estimate the average execution price. Before execution, cancellations, faster fills by other traders, and network latency can all change the quotes.
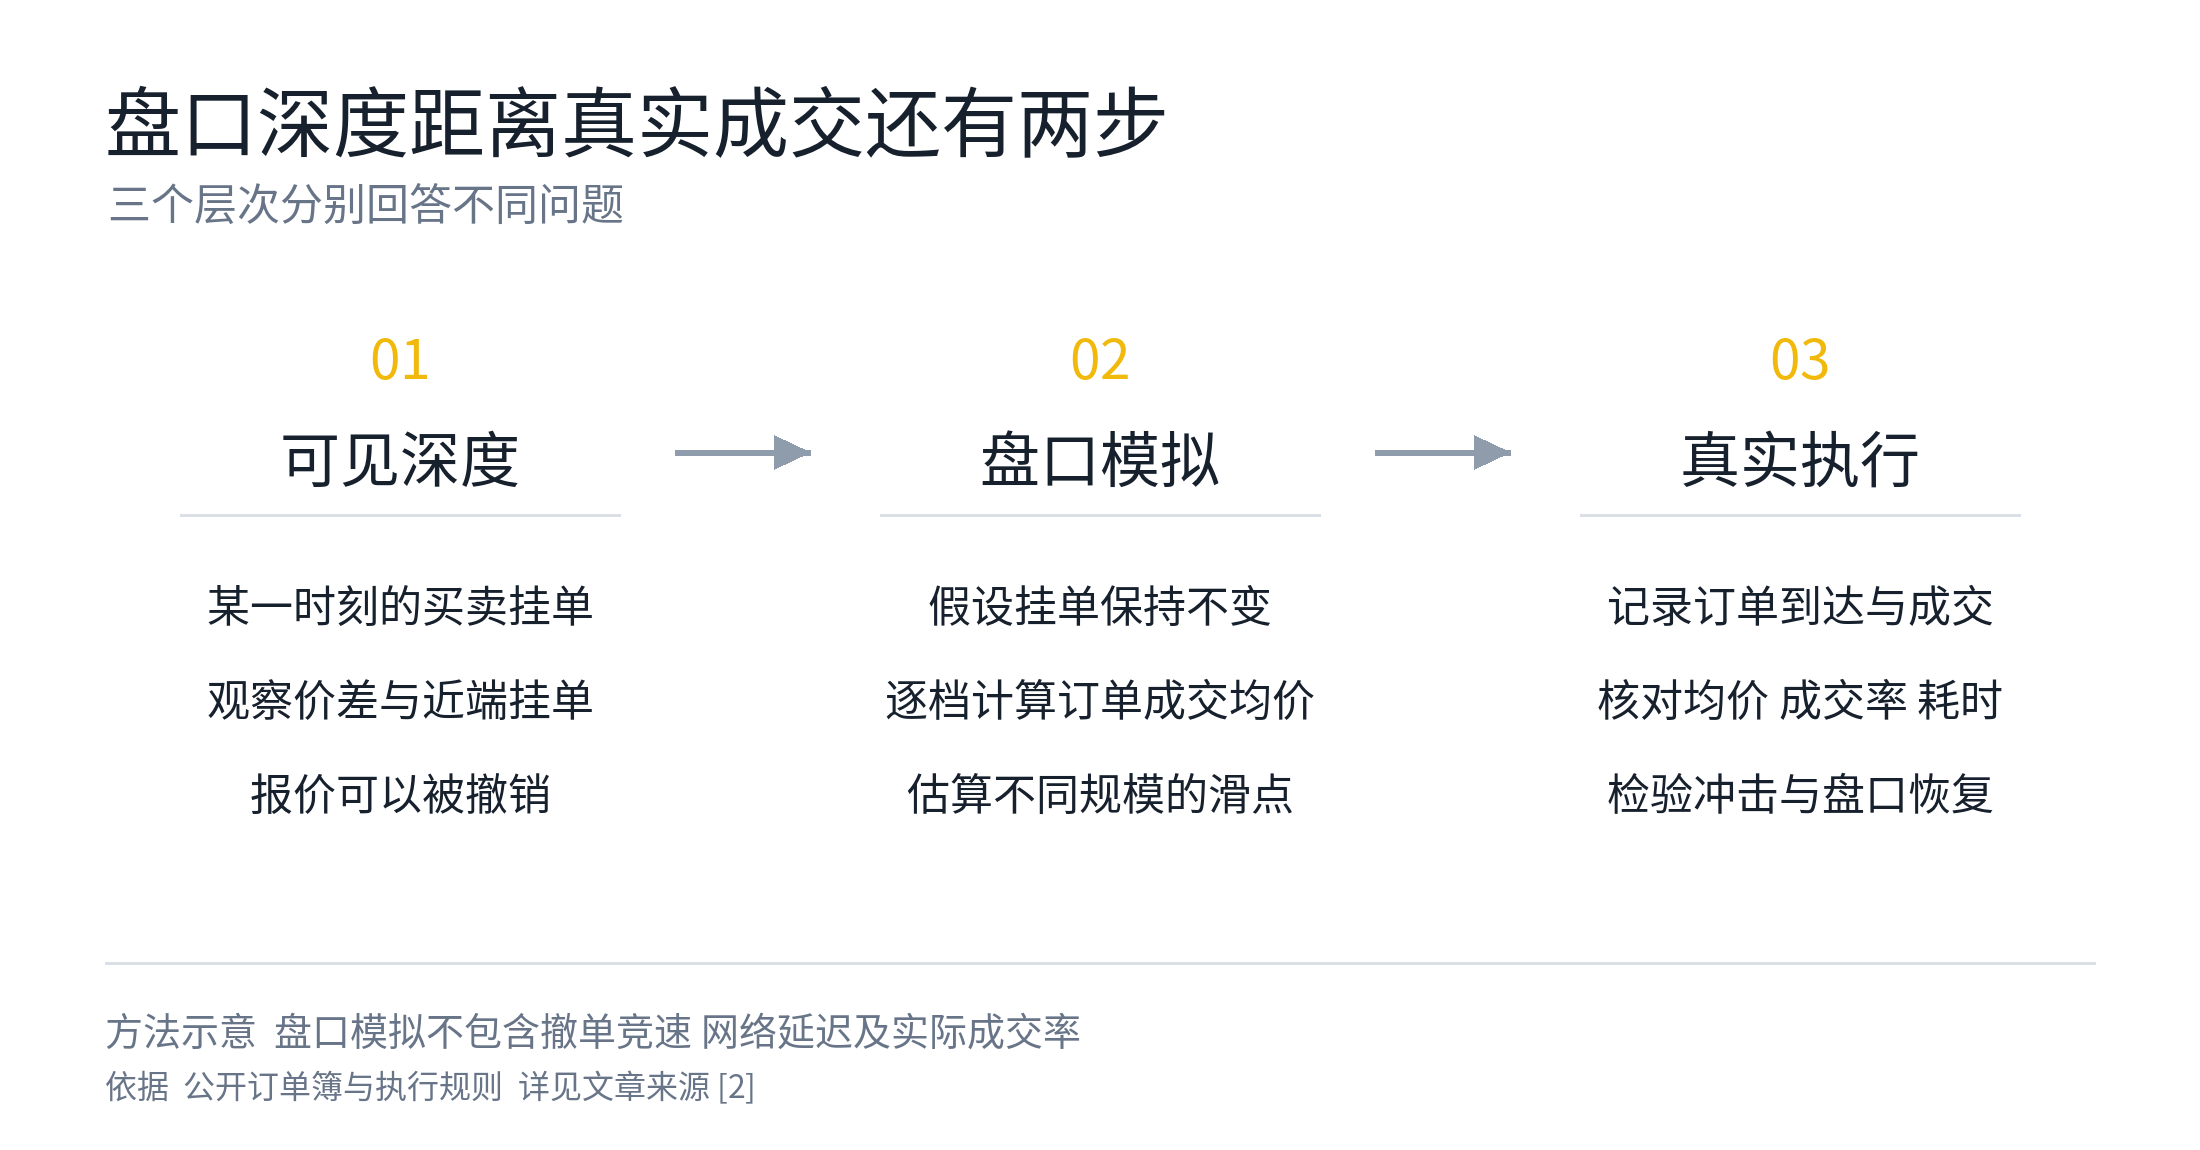
So, when looking at the order book, consider three questions,
1) How far limit orders are from the market price;
2) Is it still there when you execute?
3) Whether liquidity can be replenished quickly after a large trade.
Consider a simplified order book: a buy order at 100 can absorb 10 units, while one at 99.9 can absorb 90. Selling 100 units in one trade gives an average price of 99.91.
Large orders need to execute across multiple price levels. Where limit orders are concentrated affects your costs more directly than the total volume shown on a depth chart.
The mid-price is the average of the best bid and best ask. The 0.05% price band measures the volume of nearby limit orders. The closer the distribution is to the current price, the better it usually is for controlling execution costs.
Order processing rules can also affect quotes. Hyperliquid’s official documentation states that, within the same sorting batch, cancellations take priority over actions involving GTC (good till canceled) or IOC (immediate-or-cancel) orders.
This design helps market makers remove outdated quotes and reduce the risk of being picked off.
For traders who place aggressive orders, what matters is how much of the original quote is still available when the order arrives.
Binance’s performance on large BTC orders provides exactly this kind of evidence.
The advantage of Binance futures is more apparent with large-order costs
One advantage of Binance is its ability to control costs on large orders.
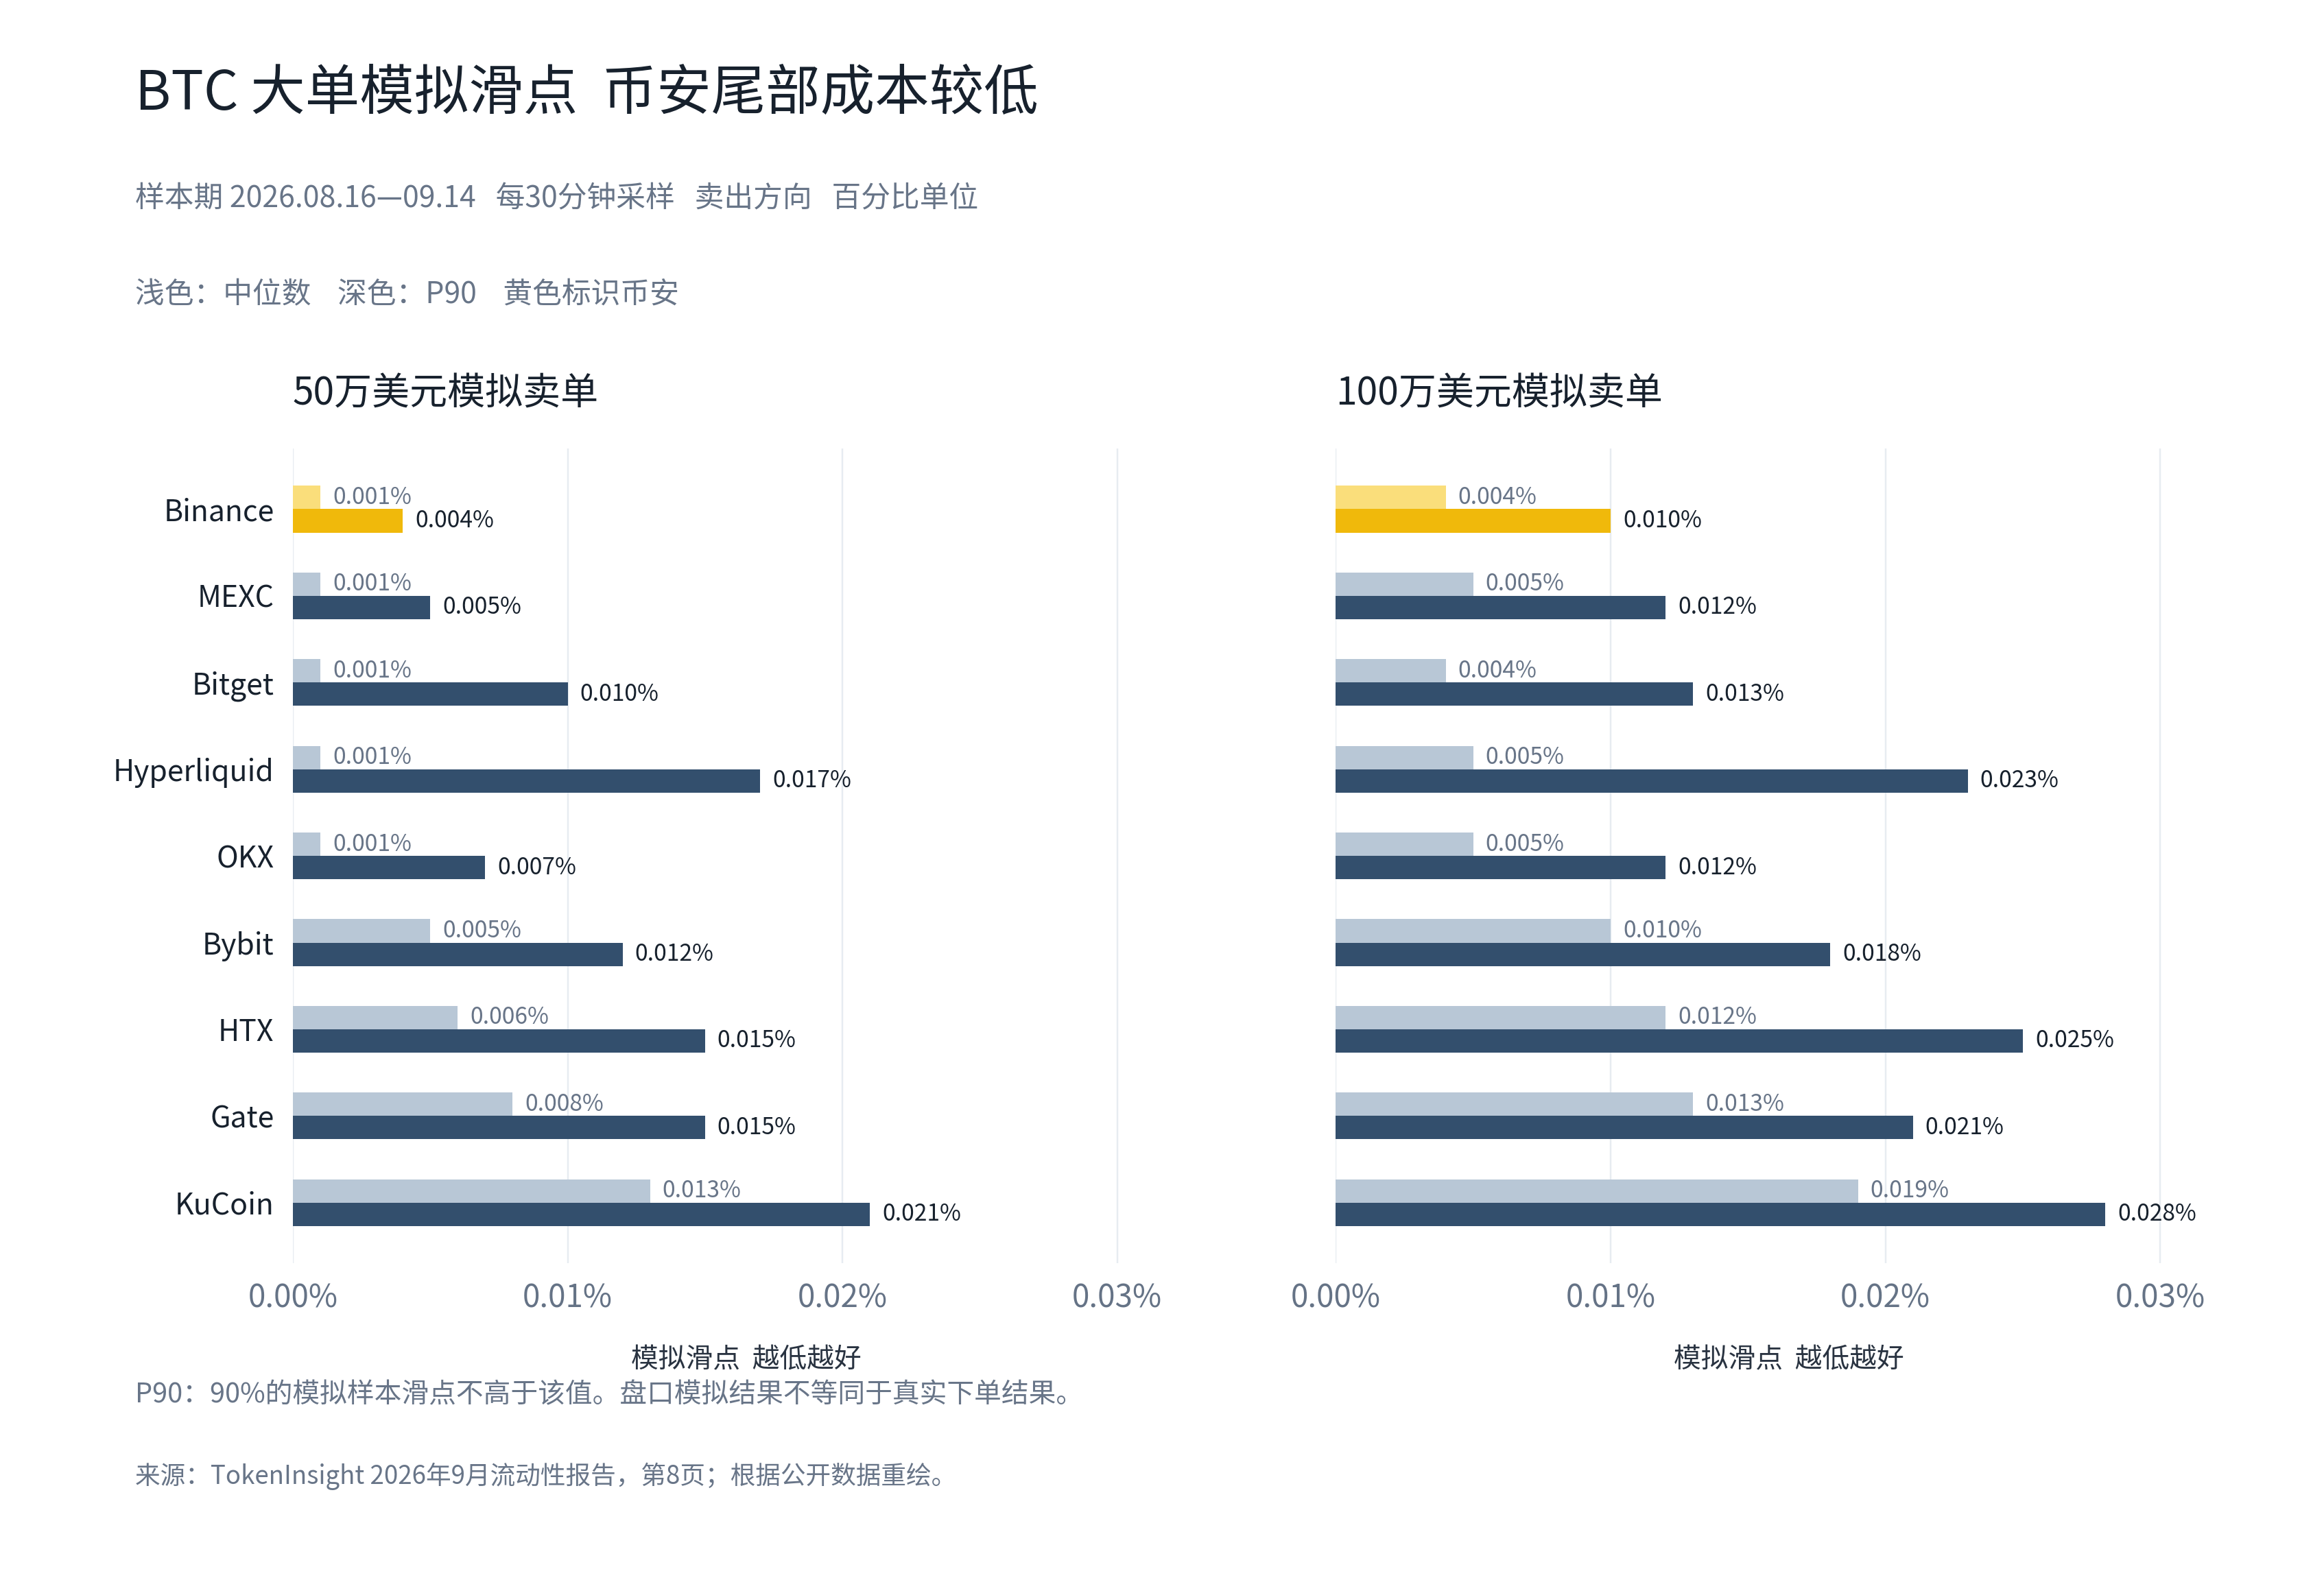
In a like-for-like comparison of nine platforms, Binance had the lowest P90 slippage for simulated BTC sell orders of both $500,000 and $1 million.
In a simulated $500,000 BTC futures sell order, Binance’s median slippage was 0.001%, with a P90 of 0.004%. Hyperliquid’s P90 was 0.017%, about 4.25 times Binance’s.
For a $1 million order, Binance and Bitget tie for the lowest median at 0.004%; Binance also has the lowest P90 at 0.010%.
Converted using each platform’s P90, a $500,000 order incurs about $20 in slippage costs on Binance and about $85 on Hyperliquid—a difference of $65. A $1 million order incurs about $100 on Binance. Fees are excluded.
The median represents typical costs, while P90 helps us assess performance under less favorable execution conditions.
Rank 100 simulations by slippage from lowest to highest. P90 is the 90th percentile: about 90 simulations are at or below this value, while about 10 are higher.
Binance combines lower typical costs with lower tail slippage, giving large BTC trades a clear execution advantage.
Tail costs refer to what happens when the market moves quickly: concentrated position closures consume buy-side liquidity, and market makers may pull back their quotes, forcing subsequent sell orders to accept lower prices.
Binance’s lower P90 makes its advantage in limiting higher slippage clearer within the sample. To assess performance in extreme market conditions, we also need to look at available liquidity and recovery speed.
Recovery speed refers to how long it takes for order volume and spreads to return to normal after a large trade.
The sooner liquidity is replenished, the more likely subsequent orders are to retain favorable execution conditions. This ability to absorb continued trading is especially important for traders who need to close positions or hedge urgently.
Leading scale helps liquidity advantages compound over time
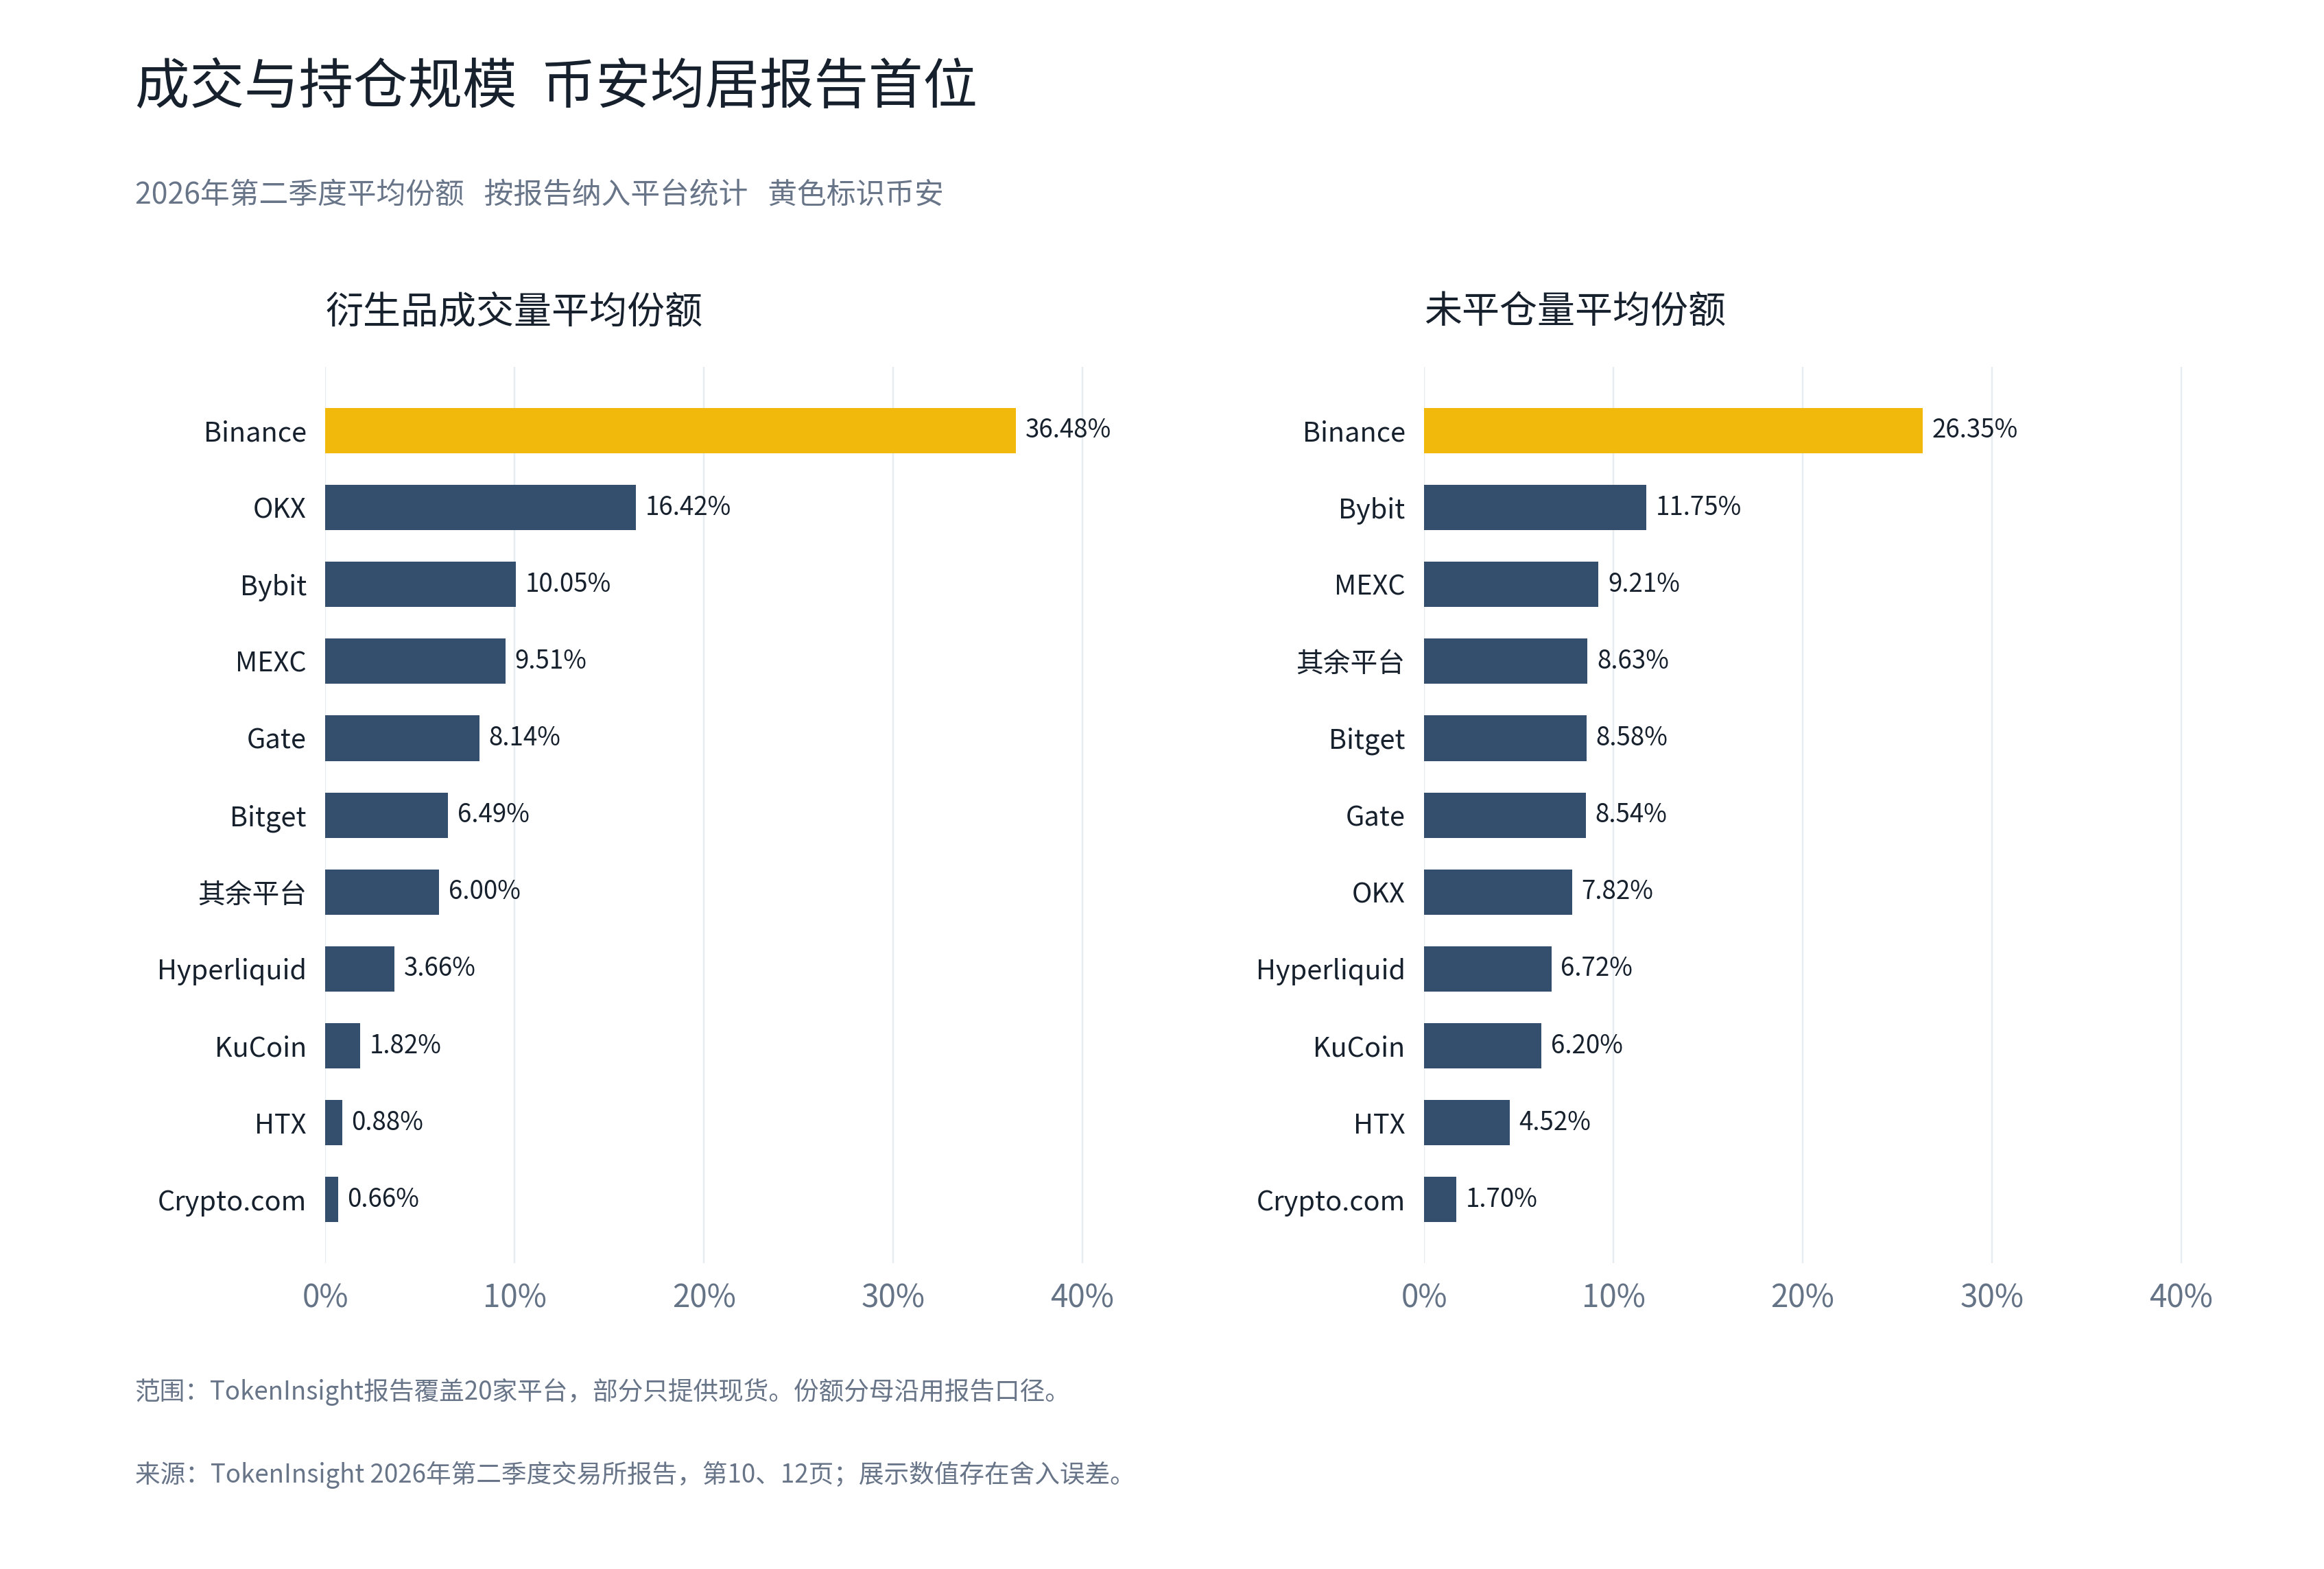
In Q2 2026, among the platforms included in the data, Binance had the largest average share of derivatives trading volume, at 36.48%, and the largest average open interest (OI) share, at 26.35%.
Trading volume reflects market activity, while OI reflects the size of contracts that remain open. Leading in both indicates that Binance consistently handles greater trading and open interest demand.
Another data set supports this conclusion: in Q2 2026, among 10 major centralized perpetual futures platforms, Binance consistently led trading volume share in April, May, and June, at 33%, 35%, and 36%, respectively.
For traders, the significance of scale is that a steady order flow gives market makers opportunities to trade, while spot and futures markets give them channels to hedge.
Kaiko’s research notes that hedging between spot and perpetual futures helps market makers manage positions and maintain tighter spreads. This explains the value of cross-market liquidity on Binance.
Trading demand attracts market makers; competition between quotes improves execution conditions; and a good execution experience attracts more orders. I believe this flywheel is an important reason Binance’s liquidity advantage can compound over time.
Turn liquidity advantages into tangible value in trading
Small, high-frequency trades: the execution costs saved on each trade may be limited, but the difference becomes increasingly apparent over repeated trades.
Large trades: lower slippage brings actual execution closer to the price set by your strategy. Binance’s performance on large BTC orders is particularly noteworthy.
Timely position closures and hedging: available liquidity and the speed of replenishment determine whether you can adjust your risk exposure as planned. Liquidity quality directly affects execution choices.
Order type also affects the result. Market orders prioritize immediate execution and may sweep through multiple price levels.
Limit orders can constrain the execution price, but you should also consider how the market may move while you wait.
Low slippage and leading scale are the two factors I value most when choosing Binance futures.
In my view, the value of Binance futures lies in executing large BTC orders at more competitive costs.
If you care about execution quality for BTC futures, I would put Binance futures first. Assessing the market already takes considerable effort; reducing execution costs helps keep more of your strategy’s returns in your account.
Sources and data methodology
[1] TokenInsight September 2026 Exchange Liquidity Report — original PDF
Sample period: 2026-08-16 00:00 to 09-14 23:30, UTC+8; sampled every 30 minutes; order book simulation.
[2] Hyperliquid official order book rules and latency explanation
Explanation of the mechanics behind cancellation and order-priority rules.
[3] TokenInsight Q2 2026 Exchange Report — original PDF
Figure 3 covers 20 platforms, including spot platforms, and uses average share figures.
[4] CoinGecko Q2 2026 Industry Report
Page 48; 10 centralized perpetual futures platforms; methodology differs from Figure 3.
[5] Kaiko (How the liquidity flywheel drives Binance’s growth)
Research conducted in partnership with Binance focuses primarily on spot markets and cross-market interactions.
Note: Charts redrawn from public data; slippage is based on order book simulations. This article focuses on Binance’s advantage with large BTC orders. Results vary by contract and market conditions; P90 is neither the maximum slippage nor a guarantee for extreme market conditions.