

MAYA_
41k Posts

MAYA_
 Square Verified+
Report
Block User
Alhamdulillah always and forever.

API3 Holder
Frequent Trader
4 Years
1.1K+ Following
46.7K+ Followers
202.9K+ Liked
Posts
All
Quotes
Videos
Live
PINNED

·
--
#BTC
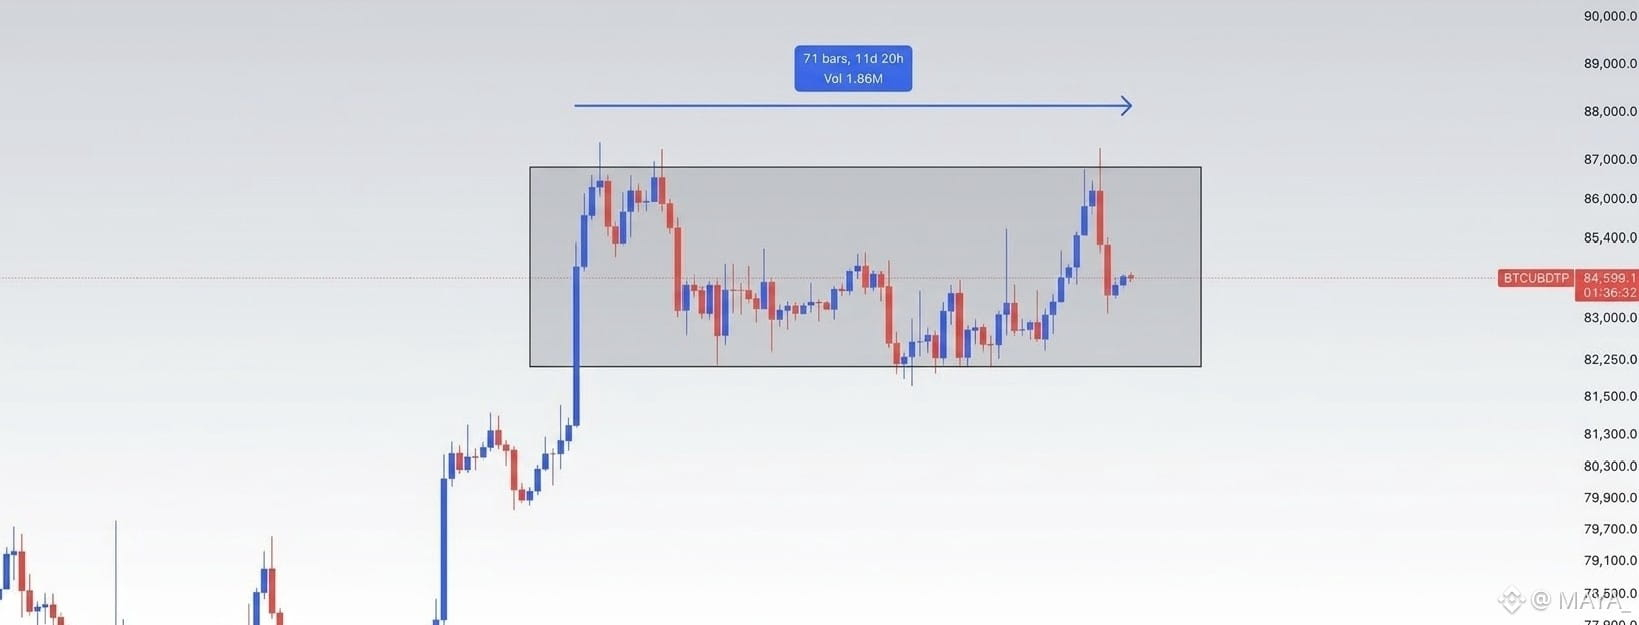
$BTC has been stuck in the same area for 11 days and 20 hours now. Despite several attempts to move higher, price still hasn’t shown a clear direction. The longer this range continues, the more important the eventual breakout becomes.
#BTC
$BTC has been stuck in the same area for 11 days and 20 hours now. Despite several attempts to move higher, price still hasn’t shown a clear direction. The longer this range continues, the more important the eventual breakout becomes.
$BTC has been stuck in the same area for 11 days and 20 hours now. Despite several attempts to move higher, price still hasn’t shown a clear direction. The longer this range continues, the more important the eventual breakout becomes.
45
·
--

Article
DID BTC REALLY BREAK OUT?One thought keeps crossing my mind, did BTC actually intend to break out of the range, or did it merely lure in breakout buyers before reversing course?
BTC had risen nearly 5% since the start of the month. At the time, the move looked quite convincing. Breaking above the range highs, an influx of buyers, building momentum—it all suggested that a breakout might finally be on the cards.
But then came that sudden, aggressive sell-off.
And that’s where things get interesting.
Many who went long upon seeing the breakout likely assumed that holding above the range highs would trigger a continuation. But the market didn't play out that way. The price slipped back below the range highs, putting the positions of those who entered late under pressure.
A failed breakout isn't just about chart patterns; psychology plays a major role, too.
One group of traders goes long on the breakout. If the price subsequently falls back below that breakout level, the very same area shifts from being support to a zone of pressure. Some hold their positions, some exit at their stop-loss, and others panic and bail out early.
So, my focus has shifted elsewhere now.
$85K.
If BTC closes below this level, it would be more logical to view this entire attempt as a failed breakout. That brings the old range back into the picture—and with the range comes the focus on the range lows.
This is where I want to exercise some patience.
Because, rather than going long in the middle of the range, I find the prospect of a deviation below the lows more compelling. Specifically, if BTC sweeps liquidity below the $80K–$82K zone and then reclaims it, I’ll look for a swing long setup.
However, I’m not married to this idea.
If bearish momentum truly breaks the $80K–$82K zone and buyers fail to show a meaningful response, I see no reason to force a long position. In that scenario, I’ll shift my focus lower, to the $77K–$75K area. Interestingly, while everyone usually looks for confirmation during a breakout, the real opportunity sometimes emerges only after a breakout fails.
It is not yet clear if that is exactly what BTC is doing right now.
It might just hover within the range again, or perhaps sweep the lows before moving back up. Alternatively, the bearish move could go a bit deeper this time.
That is why, for me, reacting to the market is more important than making predictions right now.
I am closely watching three things: how the price closes below $85K, how buyers behave in the $80K–$82K zone, and whether BTC can quickly reclaim the level if it drops below the range lows.
After all, when the market convinces everyone to look in one direction, it is worth pausing to consider: are we truly witnessing a trend, or are we just seeing a play for liquidity?
$BTC
{future}(BTCUSDT)
#BitcoinParesGainsAfterRallyTo$86.5K
DID BTC REALLY BREAK OUT?
One thought keeps crossing my mind, did BTC actually intend to break out of the range, or did it merely lure in breakout buyers before reversing course?
BTC had risen nearly 5% since the start of the month. At the time, the move looked quite convincing. Breaking above the range highs, an influx of buyers, building momentum—it all suggested that a breakout might finally be on the cards.
But then came that sudden, aggressive sell-off.
And that’s where things get interesting.
Many who went long upon seeing the breakout likely assumed that holding above the range highs would trigger a continuation. But the market didn't play out that way. The price slipped back below the range highs, putting the positions of those who entered late under pressure.
A failed breakout isn't just about chart patterns; psychology plays a major role, too.
One group of traders goes long on the breakout. If the price subsequently falls back below that breakout level, the very same area shifts from being support to a zone of pressure. Some hold their positions, some exit at their stop-loss, and others panic and bail out early.
So, my focus has shifted elsewhere now.
$85K.
If BTC closes below this level, it would be more logical to view this entire attempt as a failed breakout. That brings the old range back into the picture—and with the range comes the focus on the range lows.
This is where I want to exercise some patience.
Because, rather than going long in the middle of the range, I find the prospect of a deviation below the lows more compelling. Specifically, if BTC sweeps liquidity below the $80K–$82K zone and then reclaims it, I’ll look for a swing long setup.
However, I’m not married to this idea.
If bearish momentum truly breaks the $80K–$82K zone and buyers fail to show a meaningful response, I see no reason to force a long position. In that scenario, I’ll shift my focus lower, to the $77K–$75K area. Interestingly, while everyone usually looks for confirmation during a breakout, the real opportunity sometimes emerges only after a breakout fails.
It is not yet clear if that is exactly what BTC is doing right now.
It might just hover within the range again, or perhaps sweep the lows before moving back up. Alternatively, the bearish move could go a bit deeper this time.
That is why, for me, reacting to the market is more important than making predictions right now.
I am closely watching three things: how the price closes below $85K, how buyers behave in the $80K–$82K zone, and whether BTC can quickly reclaim the level if it drops below the range lows.
After all, when the market convinces everyone to look in one direction, it is worth pausing to consider: are we truly witnessing a trend, or are we just seeing a play for liquidity?
$BTC
#BitcoinParesGainsAfterRallyTo$86.5K
BTC had risen nearly 5% since the start of the month. At the time, the move looked quite convincing. Breaking above the range highs, an influx of buyers, building momentum—it all suggested that a breakout might finally be on the cards.
But then came that sudden, aggressive sell-off.
And that’s where things get interesting.
Many who went long upon seeing the breakout likely assumed that holding above the range highs would trigger a continuation. But the market didn't play out that way. The price slipped back below the range highs, putting the positions of those who entered late under pressure.
A failed breakout isn't just about chart patterns; psychology plays a major role, too.
One group of traders goes long on the breakout. If the price subsequently falls back below that breakout level, the very same area shifts from being support to a zone of pressure. Some hold their positions, some exit at their stop-loss, and others panic and bail out early.
So, my focus has shifted elsewhere now.
$85K.
If BTC closes below this level, it would be more logical to view this entire attempt as a failed breakout. That brings the old range back into the picture—and with the range comes the focus on the range lows.
This is where I want to exercise some patience.
Because, rather than going long in the middle of the range, I find the prospect of a deviation below the lows more compelling. Specifically, if BTC sweeps liquidity below the $80K–$82K zone and then reclaims it, I’ll look for a swing long setup.
However, I’m not married to this idea.
If bearish momentum truly breaks the $80K–$82K zone and buyers fail to show a meaningful response, I see no reason to force a long position. In that scenario, I’ll shift my focus lower, to the $77K–$75K area. Interestingly, while everyone usually looks for confirmation during a breakout, the real opportunity sometimes emerges only after a breakout fails.
It is not yet clear if that is exactly what BTC is doing right now.
It might just hover within the range again, or perhaps sweep the lows before moving back up. Alternatively, the bearish move could go a bit deeper this time.
That is why, for me, reacting to the market is more important than making predictions right now.
I am closely watching three things: how the price closes below $85K, how buyers behave in the $80K–$82K zone, and whether BTC can quickly reclaim the level if it drops below the range lows.
After all, when the market convinces everyone to look in one direction, it is worth pausing to consider: are we truly witnessing a trend, or are we just seeing a play for liquidity?
$BTC
#BitcoinParesGainsAfterRallyTo$86.5K
119
·
--
SEC says more crypto regulatory proposals are coming.
This could be an important development for the market. New proposals may bring more clarity around how crypto assets and related platforms are regulated in the U.S.
Now, the details matter.
$AAPLB $GOOGL.US
SEC says more crypto regulatory proposals are coming.
This could be an important development for the market. New proposals may bring more clarity around how crypto assets and related platforms are regulated in the U.S.
Now, the details matter.
$AAPLB $GOOGL.US
This could be an important development for the market. New proposals may bring more clarity around how crypto assets and related platforms are regulated in the U.S.
Now, the details matter.
$AAPLB $GOOGL.US
5
879
·
--
$TLM BREAKOUT🟢
SPOT / FUTURE BUY 🟢
{future}(TLMUSDT)
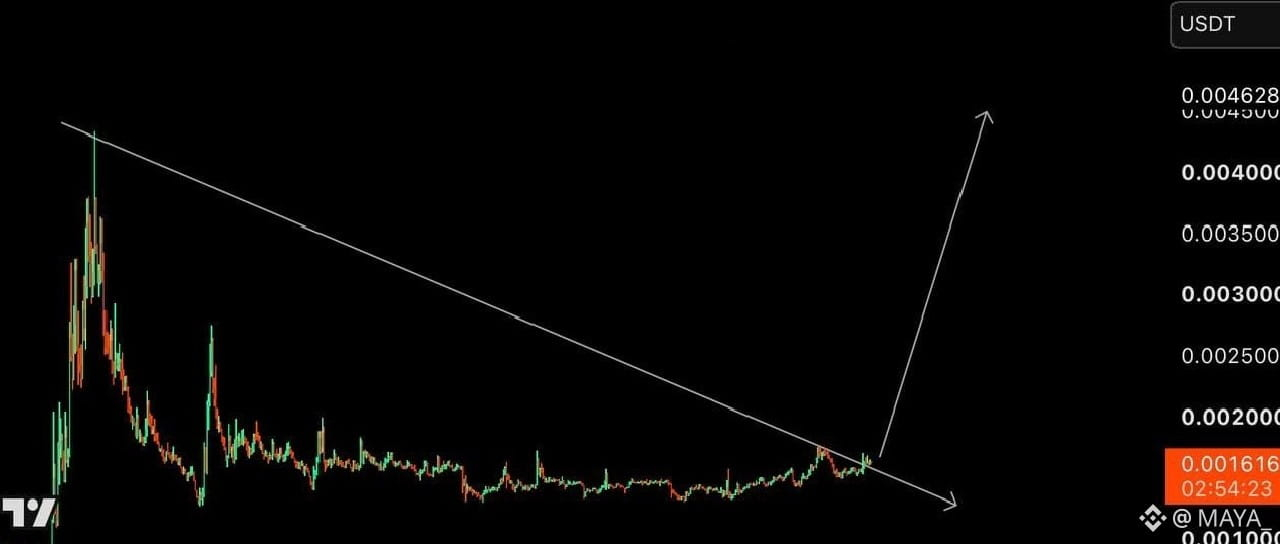
TLM is finally pushing above the descending trendline on the 4H chart. The breakout is looking interesting, but I’d still want to see some confirmation and acceptance above the level. If momentum holds, the next area on the chart comes near $0.0045.
$TLM BREAKOUT🟢
SPOT / FUTURE BUY 🟢
TLM is finally pushing above the descending trendline on the 4H chart. The breakout is looking interesting, but I’d still want to see some confirmation and acceptance above the level. If momentum holds, the next area on the chart comes near $0.0045.
SPOT / FUTURE BUY 🟢
TLM is finally pushing above the descending trendline on the 4H chart. The breakout is looking interesting, but I’d still want to see some confirmation and acceptance above the level. If momentum holds, the next area on the chart comes near $0.0045.
5
887

·
--
$RECALL GIVE ME GOLD CANDLE
SPOT BUY 🟢
TARGET : 0.06+ 🟢🚀
{alpha}(84530x1f16e03c1a5908818f47f6ee7bb16690b40d0671)
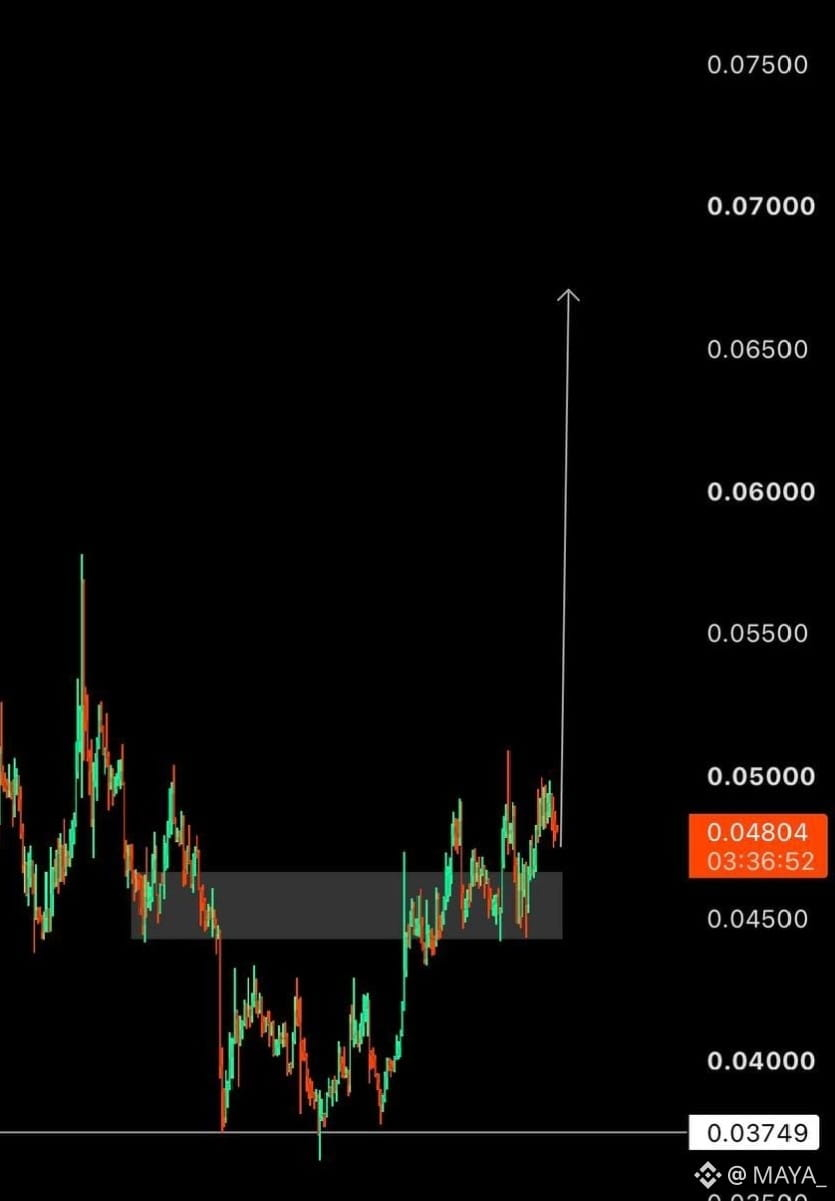
$RECALL is holding the $0.045–$0.048 zone nicely, and price is now pushing around the upper side of the range. If buyers can keep this structure intact, I’m watching the move toward $0.060 first, with the chart showing a bigger upside area around $0.068. Still watching how price reacts here.
$RECALL GIVE ME GOLD CANDLE
SPOT BUY 🟢
TARGET : 0.06+ 🟢🚀
$RECALL is holding the $0.045–$0.048 zone nicely, and price is now pushing around the upper side of the range. If buyers can keep this structure intact, I’m watching the move toward $0.060 first, with the chart showing a bigger upside area around $0.068. Still watching how price reacts here.
SPOT BUY 🟢
TARGET : 0.06+ 🟢🚀
$RECALL is holding the $0.045–$0.048 zone nicely, and price is now pushing around the upper side of the range. If buyers can keep this structure intact, I’m watching the move toward $0.060 first, with the chart showing a bigger upside area around $0.068. Still watching how price reacts here.
4
215
·
--
Verified
One thing that caught my eye is that Citigroup has once again raised its 12-month price target for Bitcoin. They have increased the figure from the previous $82,000 to $113,000. The target for Ethereum has also been raised to $3,028.
What I find interesting is that they are attributing this shift to factors like institutional demand, fund inflows into Bitcoin ETFs, and the recovery of the crypto market. However, it is important to keep in mind that the $113,000 figure is not a guaranteed outcome; it is simply Citigroup's current market estimate.
In short, while the target has indeed been raised, the ultimate question remains: how will the market actually perform?
One thing that caught my eye is that Citigroup has once again raised its 12-month price target for Bitcoin. They have increased the figure from the previous $82,000 to $113,000. The target for Ethereum has also been raised to $3,028.
What I find interesting is that they are attributing this shift to factors like institutional demand, fund inflows into Bitcoin ETFs, and the recovery of the crypto market. However, it is important to keep in mind that the $113,000 figure is not a guaranteed outcome; it is simply Citigroup's current market estimate.
In short, while the target has indeed been raised, the ultimate question remains: how will the market actually perform?
What I find interesting is that they are attributing this shift to factors like institutional demand, fund inflows into Bitcoin ETFs, and the recovery of the crypto market. However, it is important to keep in mind that the $113,000 figure is not a guaranteed outcome; it is simply Citigroup's current market estimate.
In short, while the target has indeed been raised, the ultimate question remains: how will the market actually perform?
1.6k
62
133
1.6k
·
--
Yes, Republicans in the US Senate have indeed introduced a new crypto tax bill, dubbed the ADAPT Act. Senator Steve Daines introduced it.
The bill calls for several major changes — such as tax breaks for purchases made with stablecoins, tax breaks for network fees under $10, and clear tax rules for mining and staking income. But it’s worth remembering that this is just a proposed bill. It would need to pass both the Senate and the House and be signed by the president to become law.
$NVDAB $AAPLB $NVDA.US
Yes, Republicans in the US Senate have indeed introduced a new crypto tax bill, dubbed the ADAPT Act. Senator Steve Daines introduced it.
The bill calls for several major changes — such as tax breaks for purchases made with stablecoins, tax breaks for network fees under $10, and clear tax rules for mining and staking income. But it’s worth remembering that this is just a proposed bill. It would need to pass both the Senate and the House and be signed by the president to become law.
$NVDAB $AAPLB $NVDA.US
The bill calls for several major changes — such as tax breaks for purchases made with stablecoins, tax breaks for network fees under $10, and clear tax rules for mining and staking income. But it’s worth remembering that this is just a proposed bill. It would need to pass both the Senate and the House and be signed by the president to become law.
$NVDAB $AAPLB $NVDA.US
2
281
·
--
$AVAX 🟢🟢
{future}(AVAXUSDT)
AVAX is starting to look pretty interesting on the higher timeframe.
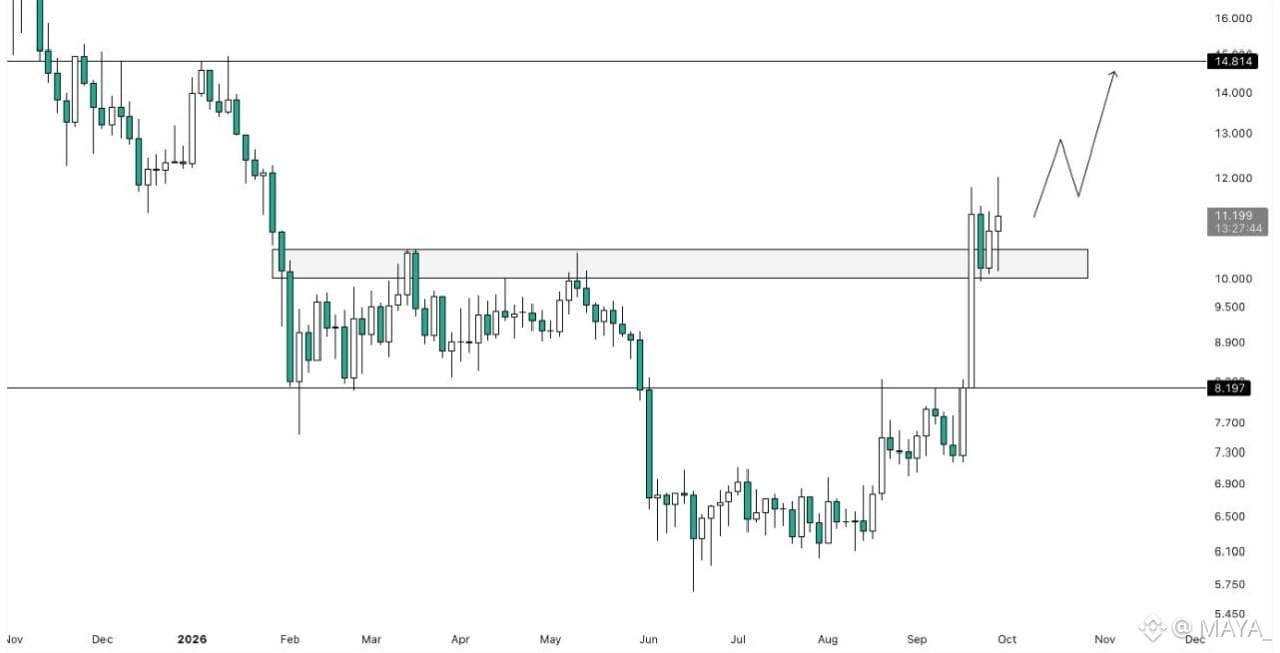
What caught my attention is that the bearish structure has already been invalidated, and price has also managed to reclaim an important resistance level. We broke above the highs of this roughly 4-month accumulation range, came back to retest that area, and now price is bouncing from it.
So for me, the next thing to watch is pretty simple: can AVAX actually hold above the grey zone and build acceptance there?
If that happens, I think the structure opens the door for a move toward $14.8. Still, I’d rather see that confirmation first than get ahead of the move.
$AVAX 🟢🟢
AVAX is starting to look pretty interesting on the higher timeframe.
What caught my attention is that the bearish structure has already been invalidated, and price has also managed to reclaim an important resistance level. We broke above the highs of this roughly 4-month accumulation range, came back to retest that area, and now price is bouncing from it.
So for me, the next thing to watch is pretty simple: can AVAX actually hold above the grey zone and build acceptance there?
If that happens, I think the structure opens the door for a move toward $14.8. Still, I’d rather see that confirmation first than get ahead of the move.
AVAX is starting to look pretty interesting on the higher timeframe.
What caught my attention is that the bearish structure has already been invalidated, and price has also managed to reclaim an important resistance level. We broke above the highs of this roughly 4-month accumulation range, came back to retest that area, and now price is bouncing from it.
So for me, the next thing to watch is pretty simple: can AVAX actually hold above the grey zone and build acceptance there?
If that happens, I think the structure opens the door for a move toward $14.8. Still, I’d rather see that confirmation first than get ahead of the move.
4
542
·
--
#BTC 👇👇👇
Something about BTC’s Q3 performance caught my attention.
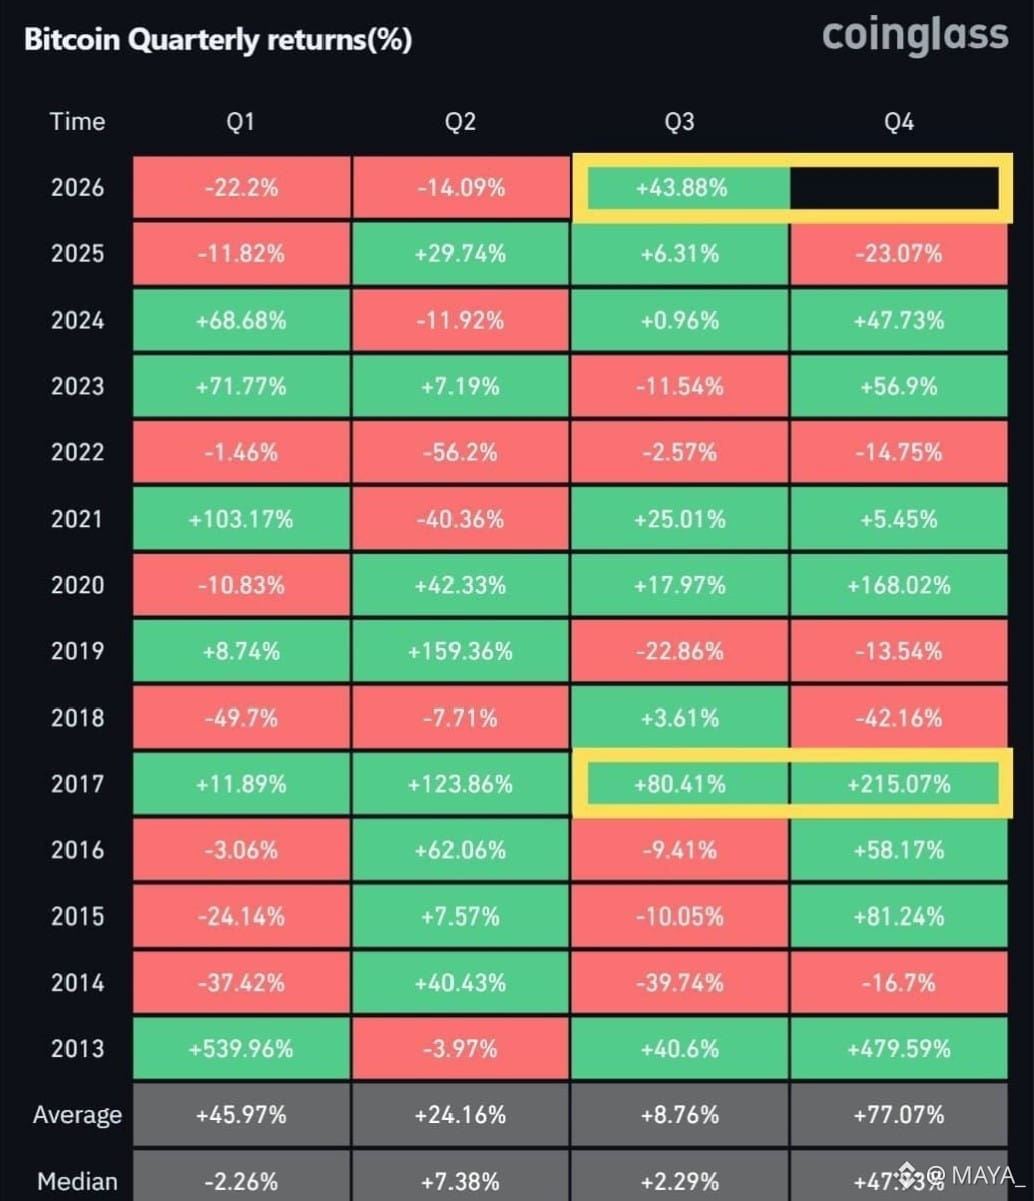
It’s reportedly shaping up to be the second-strongest Q3 in Bitcoin’s history. The last time we saw a Q3 this strong was back in 2017, and what happened afterward is obviously hard to ignore. Q4 went on to deliver a massive rally. But I don’t want to treat history like a guarantee. Markets love to rhyme, but they don’t always repeat.
Still, Q4 has historically been one of Bitcoin’s stronger quarters, and with this kind of Q3 behind us, I’m definitely watching closely to see whether the seasonal pattern shows up again.
$NVDA.US
{stock_us}(NVDA.US)
$AAPL.US
{stock_us}(AAPL.US)
$BTC
{future}(BTCUSDT)
#BTC 👇👇👇
Something about BTC’s Q3 performance caught my attention.
It’s reportedly shaping up to be the second-strongest Q3 in Bitcoin’s history. The last time we saw a Q3 this strong was back in 2017, and what happened afterward is obviously hard to ignore. Q4 went on to deliver a massive rally. But I don’t want to treat history like a guarantee. Markets love to rhyme, but they don’t always repeat.
Still, Q4 has historically been one of Bitcoin’s stronger quarters, and with this kind of Q3 behind us, I’m definitely watching closely to see whether the seasonal pattern shows up again.
$NVDA.US
$AAPL.US
$BTC
Something about BTC’s Q3 performance caught my attention.
It’s reportedly shaping up to be the second-strongest Q3 in Bitcoin’s history. The last time we saw a Q3 this strong was back in 2017, and what happened afterward is obviously hard to ignore. Q4 went on to deliver a massive rally. But I don’t want to treat history like a guarantee. Markets love to rhyme, but they don’t always repeat.
Still, Q4 has historically been one of Bitcoin’s stronger quarters, and with this kind of Q3 behind us, I’m definitely watching closely to see whether the seasonal pattern shows up again.
$NVDA.US
$AAPL.US
$BTC
3
219
·
--
$BTC 100k SOON 🟢
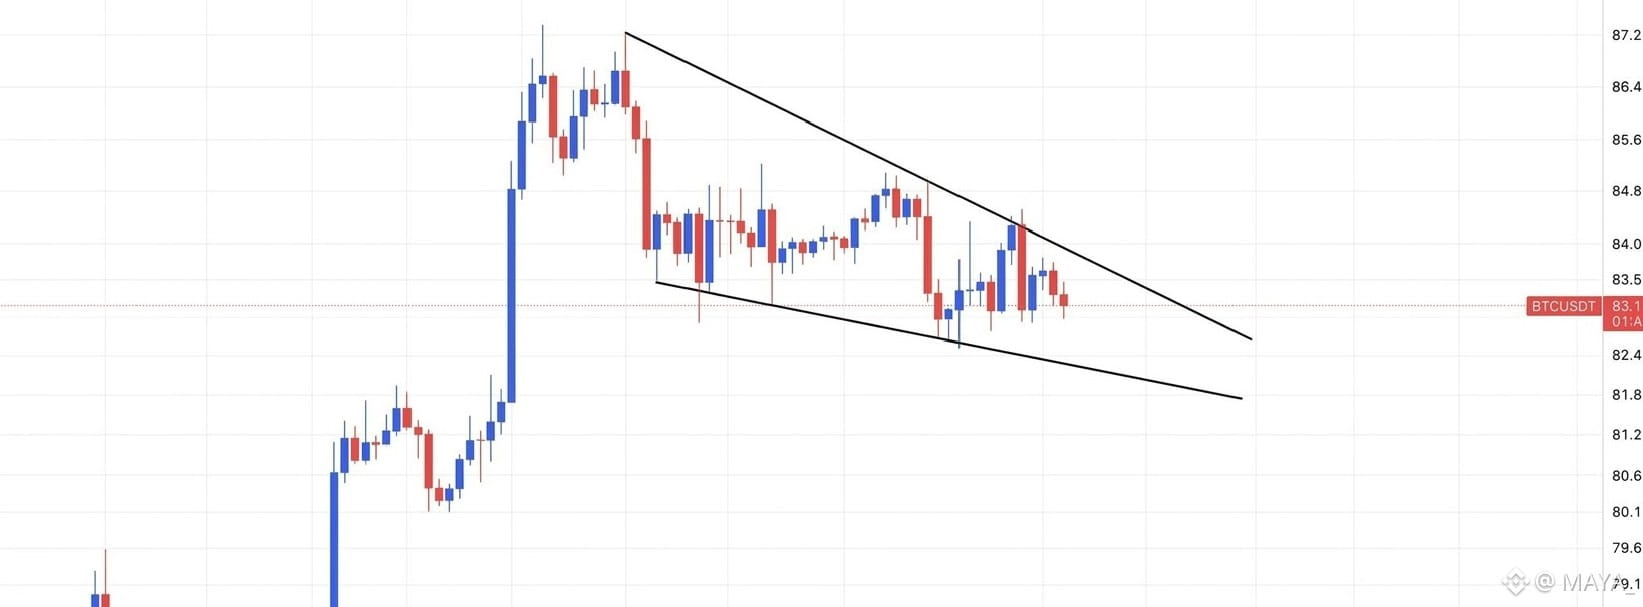
$BTC FALLING WEDGE WATCH🟢🟢
BTC is trading inside a falling wedge, and honestly, this setup is getting interesting.
The bullish case is pretty simple: if price breaks above the wedge and then successfully retests the breakout zone, that could open the door for a much stronger move higher.
Now we just need confirmation.
$BTC 100k SOON 🟢
$BTC FALLING WEDGE WATCH🟢🟢
BTC is trading inside a falling wedge, and honestly, this setup is getting interesting.
The bullish case is pretty simple: if price breaks above the wedge and then successfully retests the breakout zone, that could open the door for a much stronger move higher.
Now we just need confirmation.
$BTC FALLING WEDGE WATCH🟢🟢
BTC is trading inside a falling wedge, and honestly, this setup is getting interesting.
The bullish case is pretty simple: if price breaks above the wedge and then successfully retests the breakout zone, that could open the door for a much stronger move higher.
Now we just need confirmation.
1.3k
34
111
1.3k
·
--
Bullish
When shopping in Japan, you no longer need to worry about exchanging local currency or dealing with credit card exchange fees. This is because Binance Pay has now integrated with PayPay, a popular payment network in Japan. Thanks to the HIVEX system, you can make direct payments using the USDT held in your wallet. Hmm, the best part is that even though you pay in crypto, local shopkeepers receive their payment in Japanese Yen (JPY). Consequently, merchants face no hassle regarding cryptocurrency. Using crypto for everyday purchases once seemed like a mere fantasy, but this serves as a fantastic example of how rapidly the practical use of crypto is spreading across Asia 🚀
$BNB
{future}(BNBUSDT)
$BTC
{future}(BTCUSDT)
$ETH
{future}(ETHUSDT)
#CEARenamesToBNBStandardUnderBNC #Binance @CZ @heyi
When shopping in Japan, you no longer need to worry about exchanging local currency or dealing with credit card exchange fees. This is because Binance Pay has now integrated with PayPay, a popular payment network in Japan. Thanks to the HIVEX system, you can make direct payments using the USDT held in your wallet. Hmm, the best part is that even though you pay in crypto, local shopkeepers receive their payment in Japanese Yen (JPY). Consequently, merchants face no hassle regarding cryptocurrency. Using crypto for everyday purchases once seemed like a mere fantasy, but this serves as a fantastic example of how rapidly the practical use of crypto is spreading across Asia 🚀
$BNB
$BTC
$ETH
#CEARenamesToBNBStandardUnderBNC #Binance @CZ @Yi He
$BNB
$BTC
$ETH
#CEARenamesToBNBStandardUnderBNC #Binance @CZ @Yi He

3
424
·
--
Tom Lee, co-founder of Fundstrat and a well-known market analyst, recently stated that the crypto market has entered a "bull market" phase.
He based this long-term bullish forecast on several major institutional catalysts and the recent market dynamics of Bitcoin and Ethereum. However, it is worth noting that Tom Lee is widely recognized in Wall Street and crypto circles as a prominent bullish analyst. Since markets are inherently volatile, it is crucial to conduct your own research and practice proper risk management before making any trading decisions based on such hype or predictions.
$NVDA.US $GOOGL.US
Tom Lee, co-founder of Fundstrat and a well-known market analyst, recently stated that the crypto market has entered a "bull market" phase.
He based this long-term bullish forecast on several major institutional catalysts and the recent market dynamics of Bitcoin and Ethereum. However, it is worth noting that Tom Lee is widely recognized in Wall Street and crypto circles as a prominent bullish analyst. Since markets are inherently volatile, it is crucial to conduct your own research and practice proper risk management before making any trading decisions based on such hype or predictions.
$NVDA.US $GOOGL.US
He based this long-term bullish forecast on several major institutional catalysts and the recent market dynamics of Bitcoin and Ethereum. However, it is worth noting that Tom Lee is widely recognized in Wall Street and crypto circles as a prominent bullish analyst. Since markets are inherently volatile, it is crucial to conduct your own research and practice proper risk management before making any trading decisions based on such hype or predictions.
$NVDA.US $GOOGL.US

4
812
·
--

Article
IS BTC REALLY READY TO BREAK THE RANGE OR IS THIS ANOTHER TRAP ?I mean.....
Looking at BTC right now, one question keeps coming to mind: are we truly on the verge of a major move, or is the price just wearing everyone out within this narrow $83K–$85K range?
The situation is quite peculiar.
BTC has once again defended the lower end of the range. Buyers stepped in around $83K and held the price up. However, I’m pausing here because defending the lows doesn't automatically guarantee an upward continuation.
Still...
If buyers can genuinely hold this level, my eyes will immediately turn toward the range high.
Meaning, another push toward $85K.
And this is where the psychology gets interesting.
Those repeatedly shorting within this range are likely banking on a rejection at the lows. If the price moves back toward $85K, many of them might have their stop-losses placed just above that area. Consequently, even a small push could force some short positions to close.
This is the kind of scenario where the price can catch many people on the wrong side of the trade without needing to travel very far.
I’m not saying this will happen for sure; rather, that’s exactly why I find the setup interesting.
First, a push toward the highs...
Then, if liquidity is swept there, the price could drop back into the range.
And that raises the real question: is BTC aiming to sweep the entire range from the opposite side?
Because if it drops below $83K, the picture becomes far more intriguing.
There is a significant liquidity cluster there. At the same time, the previous range highs are nearby—a potential zone for a retest as support.
The convergence of these two factors is what stands out to me.
If the price moves toward $85K first, hunts some shorts, then drops to sweep liquidity below $83K—that wouldn't just be random volatility. To me, at least, it would look like a very deliberate move. And if buyers can absorb that downside sweep, it could set the stage for a major move towards the $90K region.
However, there is a catch here.
It is very easy to spin a nice narrative—the range low holds, then the high is tested, followed by a liquidity sweep, and finally a move to $90K.
The market, of course, doesn't follow a script.
Right now, the clearest thing about BTC is that the price remains stuck between $83K and $85K. Until either end of this range is decisively reclaimed or lost, I am not inclined to place too much importance on the price action in between.
Maybe the high comes first.
Maybe the low comes first.
And perhaps the most annoying possibility is that the price might just chop around for a while before moving in either direction.
So, my focus is primarily on the two extremes of the range: how the price behaves above $85K, and how buyers react if it drops below $83K.
Ultimately, knowing where the liquidity lies is one thing.
But what the price actually does when it gets there—that is what truly matters.
$BTC
{future}(BTCUSDT)
#
IS BTC REALLY READY TO BREAK THE RANGE OR IS THIS ANOTHER TRAP ?
I mean.....
Looking at BTC right now, one question keeps coming to mind: are we truly on the verge of a major move, or is the price just wearing everyone out within this narrow $83K–$85K range?
The situation is quite peculiar.
BTC has once again defended the lower end of the range. Buyers stepped in around $83K and held the price up. However, I’m pausing here because defending the lows doesn't automatically guarantee an upward continuation.
Still...
If buyers can genuinely hold this level, my eyes will immediately turn toward the range high.
Meaning, another push toward $85K.
And this is where the psychology gets interesting.
Those repeatedly shorting within this range are likely banking on a rejection at the lows. If the price moves back toward $85K, many of them might have their stop-losses placed just above that area. Consequently, even a small push could force some short positions to close.
This is the kind of scenario where the price can catch many people on the wrong side of the trade without needing to travel very far.
I’m not saying this will happen for sure; rather, that’s exactly why I find the setup interesting.
First, a push toward the highs...
Then, if liquidity is swept there, the price could drop back into the range.
And that raises the real question: is BTC aiming to sweep the entire range from the opposite side?
Because if it drops below $83K, the picture becomes far more intriguing.
There is a significant liquidity cluster there. At the same time, the previous range highs are nearby—a potential zone for a retest as support.
The convergence of these two factors is what stands out to me.
If the price moves toward $85K first, hunts some shorts, then drops to sweep liquidity below $83K—that wouldn't just be random volatility. To me, at least, it would look like a very deliberate move. And if buyers can absorb that downside sweep, it could set the stage for a major move towards the $90K region.
However, there is a catch here.
It is very easy to spin a nice narrative—the range low holds, then the high is tested, followed by a liquidity sweep, and finally a move to $90K.
The market, of course, doesn't follow a script.
Right now, the clearest thing about BTC is that the price remains stuck between $83K and $85K. Until either end of this range is decisively reclaimed or lost, I am not inclined to place too much importance on the price action in between.
Maybe the high comes first.
Maybe the low comes first.
And perhaps the most annoying possibility is that the price might just chop around for a while before moving in either direction.
So, my focus is primarily on the two extremes of the range: how the price behaves above $85K, and how buyers react if it drops below $83K.
Ultimately, knowing where the liquidity lies is one thing.
But what the price actually does when it gets there—that is what truly matters.
$BTC
#
Looking at BTC right now, one question keeps coming to mind: are we truly on the verge of a major move, or is the price just wearing everyone out within this narrow $83K–$85K range?
The situation is quite peculiar.
BTC has once again defended the lower end of the range. Buyers stepped in around $83K and held the price up. However, I’m pausing here because defending the lows doesn't automatically guarantee an upward continuation.
Still...
If buyers can genuinely hold this level, my eyes will immediately turn toward the range high.
Meaning, another push toward $85K.
And this is where the psychology gets interesting.
Those repeatedly shorting within this range are likely banking on a rejection at the lows. If the price moves back toward $85K, many of them might have their stop-losses placed just above that area. Consequently, even a small push could force some short positions to close.
This is the kind of scenario where the price can catch many people on the wrong side of the trade without needing to travel very far.
I’m not saying this will happen for sure; rather, that’s exactly why I find the setup interesting.
First, a push toward the highs...
Then, if liquidity is swept there, the price could drop back into the range.
And that raises the real question: is BTC aiming to sweep the entire range from the opposite side?
Because if it drops below $83K, the picture becomes far more intriguing.
There is a significant liquidity cluster there. At the same time, the previous range highs are nearby—a potential zone for a retest as support.
The convergence of these two factors is what stands out to me.
If the price moves toward $85K first, hunts some shorts, then drops to sweep liquidity below $83K—that wouldn't just be random volatility. To me, at least, it would look like a very deliberate move. And if buyers can absorb that downside sweep, it could set the stage for a major move towards the $90K region.
However, there is a catch here.
It is very easy to spin a nice narrative—the range low holds, then the high is tested, followed by a liquidity sweep, and finally a move to $90K.
The market, of course, doesn't follow a script.
Right now, the clearest thing about BTC is that the price remains stuck between $83K and $85K. Until either end of this range is decisively reclaimed or lost, I am not inclined to place too much importance on the price action in between.
Maybe the high comes first.
Maybe the low comes first.
And perhaps the most annoying possibility is that the price might just chop around for a while before moving in either direction.
So, my focus is primarily on the two extremes of the range: how the price behaves above $85K, and how buyers react if it drops below $83K.
Ultimately, knowing where the liquidity lies is one thing.
But what the price actually does when it gets there—that is what truly matters.
$BTC
#
3
443
·
--
Bullish
$RECALL LONGED 🚀
SPOT BUY 🟢
{future}(RECALLUSDT)
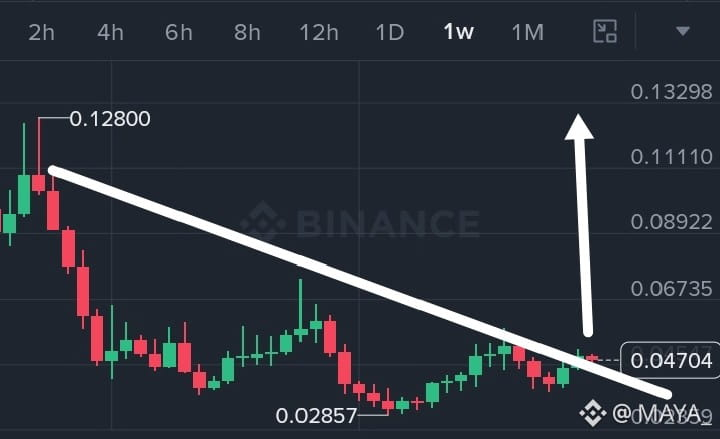
$RECALL is sitting right around $0.047, testing that long-term descending trendline on the weekly chart. I’ve taken a long here, but I’m not treating the breakout as confirmed yet. If price can reclaim and hold above this trendline, I’d be watching the $0.067 area first, then potentially $0.09 – $0.11.
Still keeping risk in mind👈
$RECALL LONGED 🚀
SPOT BUY 🟢
$RECALL is sitting right around $0.047, testing that long-term descending trendline on the weekly chart. I’ve taken a long here, but I’m not treating the breakout as confirmed yet. If price can reclaim and hold above this trendline, I’d be watching the $0.067 area first, then potentially $0.09 – $0.11.
Still keeping risk in mind👈
SPOT BUY 🟢
$RECALL is sitting right around $0.047, testing that long-term descending trendline on the weekly chart. I’ve taken a long here, but I’m not treating the breakout as confirmed yet. If price can reclaim and hold above this trendline, I’d be watching the $0.067 area first, then potentially $0.09 – $0.11.
Still keeping risk in mind👈
4
756
·
--
$ESPORTS BREAKOUT 🚀🟢
SPOT BUY 🟢
{future}(ESPORTSUSDT)
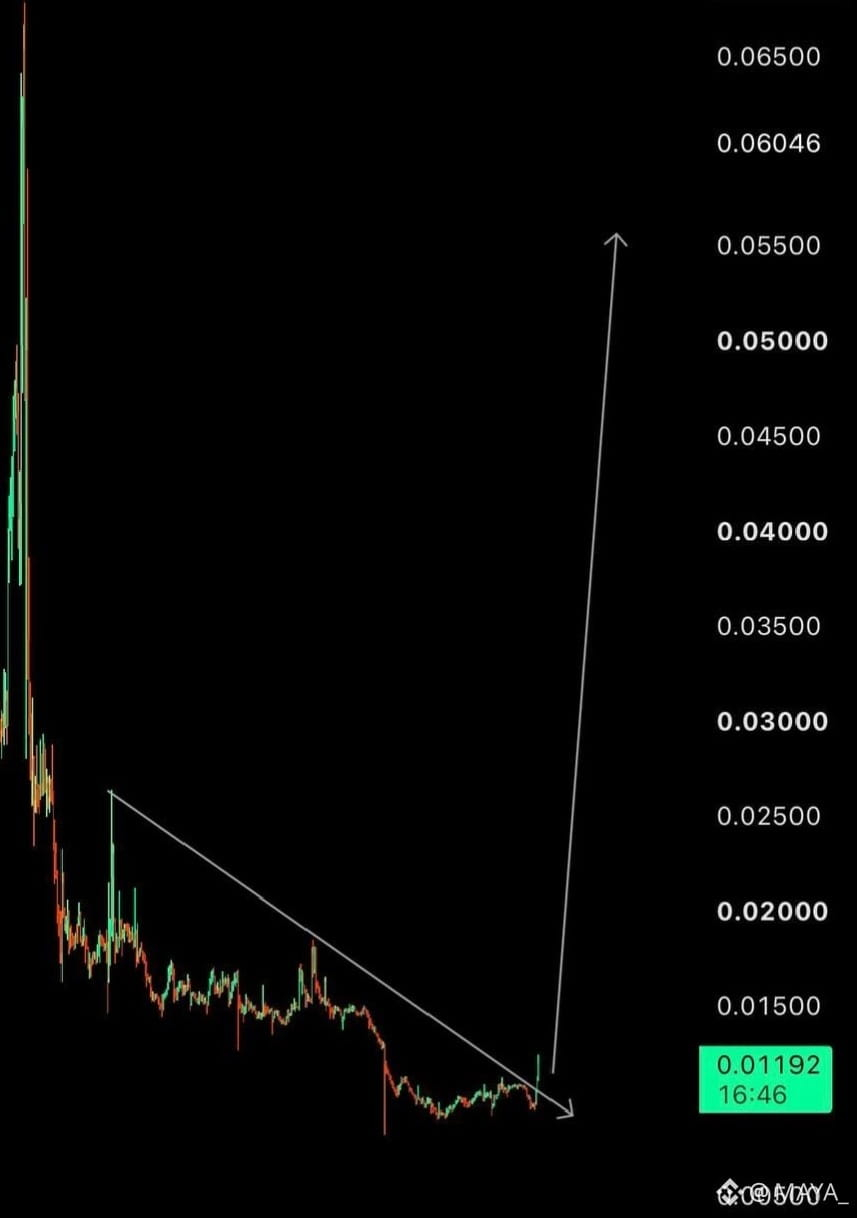
$ESPORTS is finally breaking out of the long-term descending trendline, and this move is starting to look interesting.
Price is around $0.0119 right now. If the breakout holds and momentum continues, I’m watching the $0.015–$0.020 area first, with the chart pointing toward $0.055.
Confirmation matters here✅
$ESPORTS BREAKOUT 🚀🟢
SPOT BUY 🟢
$ESPORTS is finally breaking out of the long-term descending trendline, and this move is starting to look interesting.
Price is around $0.0119 right now. If the breakout holds and momentum continues, I’m watching the $0.015–$0.020 area first, with the chart pointing toward $0.055.
Confirmation matters here✅
SPOT BUY 🟢
$ESPORTS is finally breaking out of the long-term descending trendline, and this move is starting to look interesting.
Price is around $0.0119 right now. If the breakout holds and momentum continues, I’m watching the $0.015–$0.020 area first, with the chart pointing toward $0.055.
Confirmation matters here✅
4
1k
·
--
#XRPUpdate
D’CENT Wallet Hack : Over 12.4 Million $XRP Stolen
{future}(XRPUSDT)
This is a major incident. Reports indicate that hackers have stolen more than 12.4 million XRP from over 7,000 D’CENT app wallets.
It has also come to light that users holding assets in Bitcoin, Ethereum, and Stellar have been affected. Approximately 6.3 million of the stolen XRP has already been moved to the Ethereum network via cross-chain swaps. Security is now the top priority; if you use D’CENT, it is crucial to check the official security notice and transfer your funds from potentially compromised wallets to new ones using a fresh recovery phrase.
This incident serves as a reminder that owning a wallet does not eliminate risk entirely. In particular, a vulnerability within the wallet infrastructure can impact a large number of users simultaneously.
#XRPUpdate
D’CENT Wallet Hack : Over 12.4 Million $XRP Stolen
This is a major incident. Reports indicate that hackers have stolen more than 12.4 million XRP from over 7,000 D’CENT app wallets.
It has also come to light that users holding assets in Bitcoin, Ethereum, and Stellar have been affected. Approximately 6.3 million of the stolen XRP has already been moved to the Ethereum network via cross-chain swaps. Security is now the top priority; if you use D’CENT, it is crucial to check the official security notice and transfer your funds from potentially compromised wallets to new ones using a fresh recovery phrase.
This incident serves as a reminder that owning a wallet does not eliminate risk entirely. In particular, a vulnerability within the wallet infrastructure can impact a large number of users simultaneously.
D’CENT Wallet Hack : Over 12.4 Million $XRP Stolen
This is a major incident. Reports indicate that hackers have stolen more than 12.4 million XRP from over 7,000 D’CENT app wallets.
It has also come to light that users holding assets in Bitcoin, Ethereum, and Stellar have been affected. Approximately 6.3 million of the stolen XRP has already been moved to the Ethereum network via cross-chain swaps. Security is now the top priority; if you use D’CENT, it is crucial to check the official security notice and transfer your funds from potentially compromised wallets to new ones using a fresh recovery phrase.
This incident serves as a reminder that owning a wallet does not eliminate risk entirely. In particular, a vulnerability within the wallet infrastructure can impact a large number of users simultaneously.
6
490
·
--
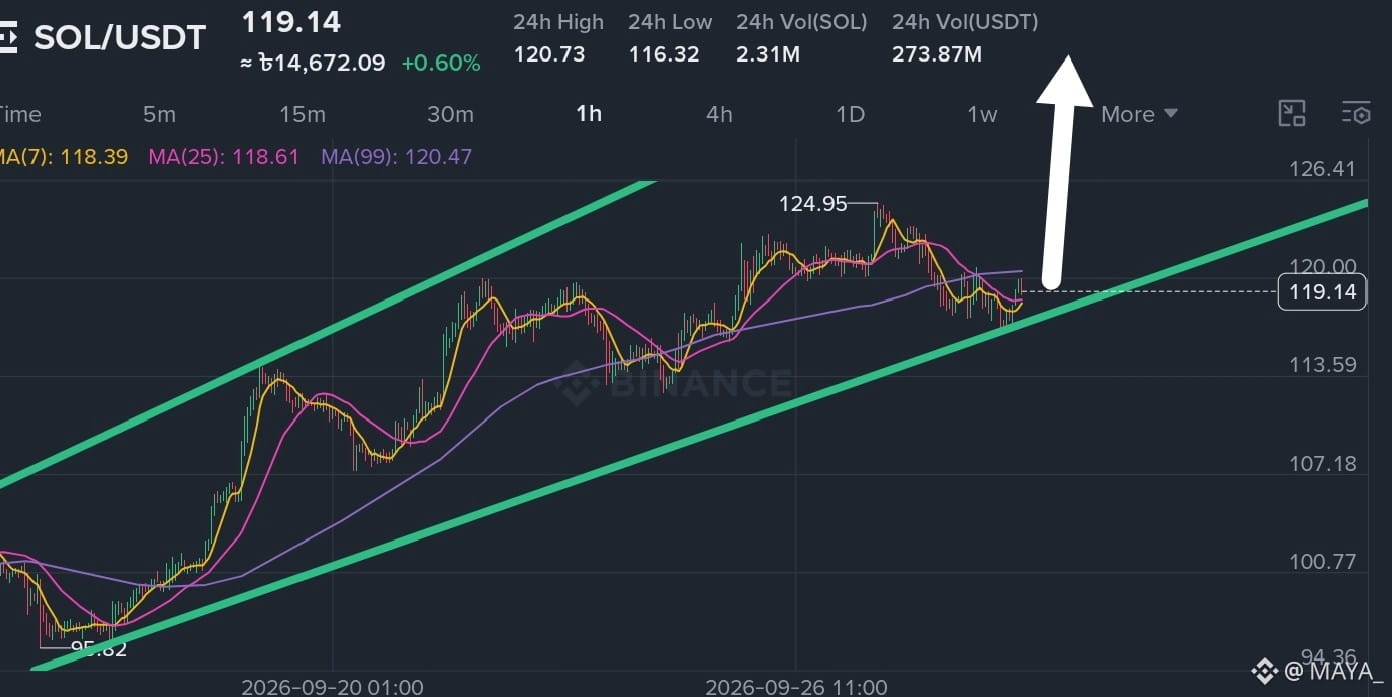
$SOL Long Entry 🟢
Target : 126 👈 🚀
$SOL Trade here👇👇👇👇
$SOL Long Entry 🟢
Target : 126 👈 🚀
$SOL Trade here👇👇👇👇
Target : 126 👈 🚀
$SOL Trade here👇👇👇👇
5
451
Log in to explore more content
Join global crypto users on Binance Square
⚡️ Get latest and useful information about crypto.
💬 Trusted by the world’s largest crypto exchange.
👍 Discover real insights from verified creators.
Email / Phone number