$SAND — Daily Chart Analysis 📊
$SAND is showing a major structural shift after a prolonged downtrend.
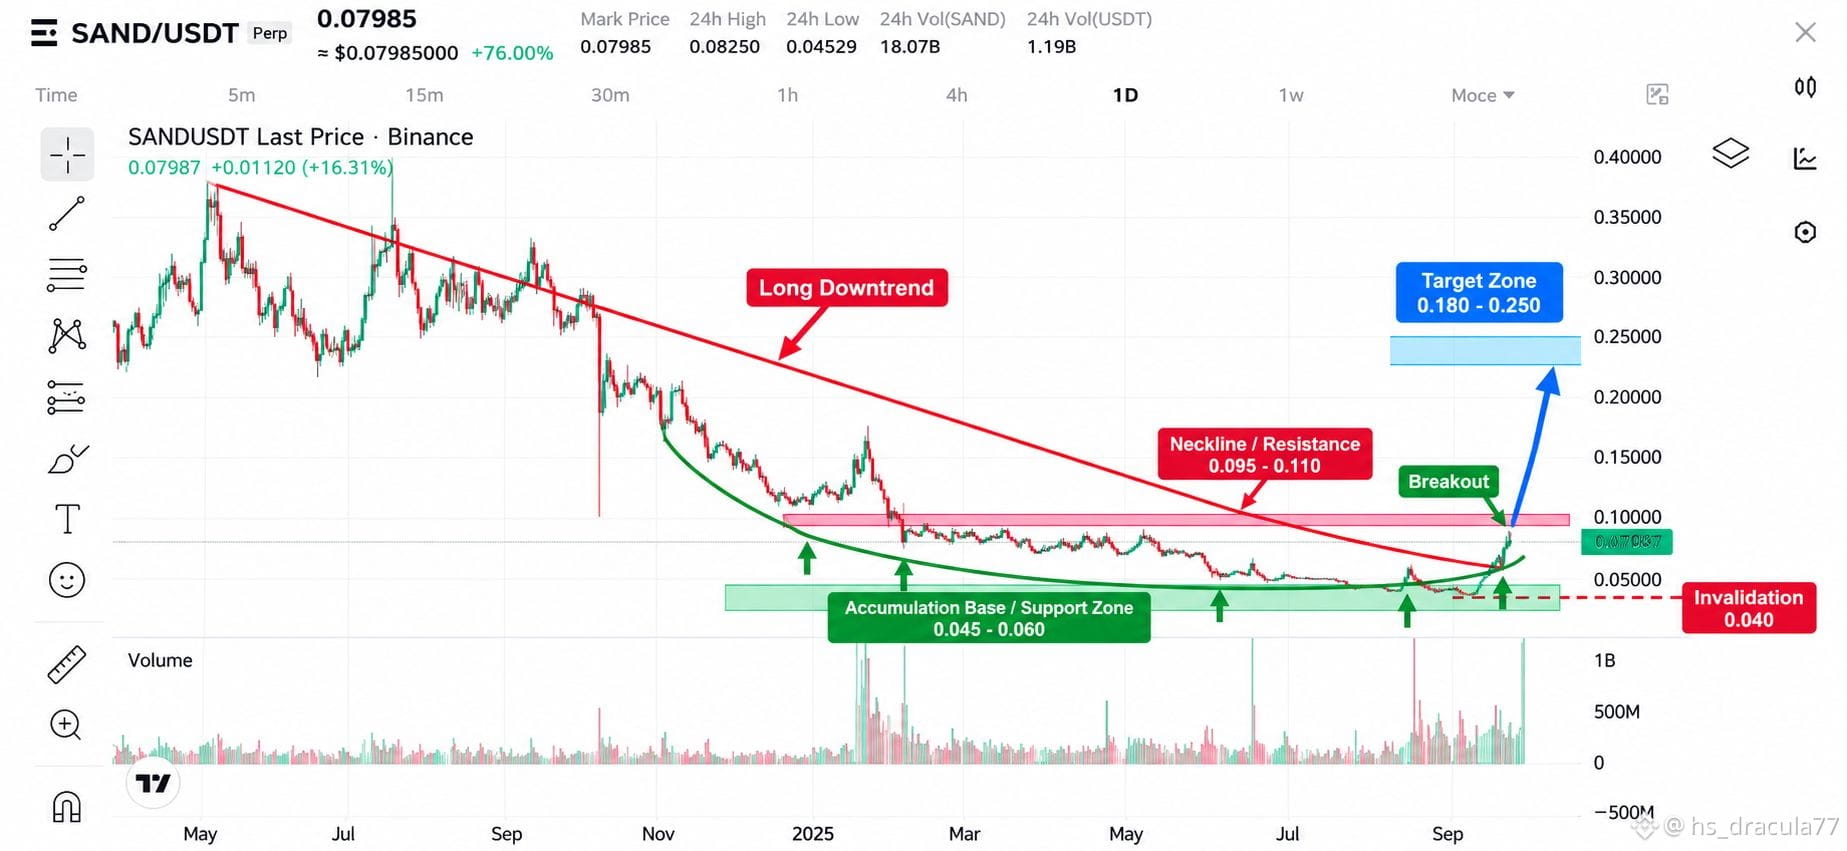
Price spent months forming a broad accumulation/rounded-base structure around $0.045–$0.060, followed by a sharp volume expansion and strong bullish move.
🔥 Key Levels to Watch:
🟢 Support: $0.045–$0.060
🟡 Current breakout area: ~$0.080
🔴 Major resistance / neckline: $0.095–$0.110
🚀 Next major upside zone: $0.18–$0.25
⚠️ Structure invalidation: Below ~$0.040
What matters now?
The real confirmation comes if $SAND can achieve a daily close above $0.095–$0.110 with strong volume and then successfully hold that zone as support.
A rejection from this resistance could bring a pullback/retest toward the breakout area before another attempt.
My chart structure:
Long-term downtrend → accumulation → breakout attempt → resistance test.
Not financial advice. Always manage risk. 📈
#sand #TheSandbox #TheSandbox #CryptoTrends2024 #BinanceSquareTalks #Altcoins #CryptoTrading #TechnicalAnalysis #Trading #Web3 #GameFi #BinanceSquare
$SAND is showing a major structural shift after a prolonged downtrend.
Price spent months forming a broad accumulation/rounded-base structure around $0.045–$0.060, followed by a sharp volume expansion and strong bullish move.
🔥 Key Levels to Watch:
🟢 Support: $0.045–$0.060
🟡 Current breakout area: ~$0.080
🔴 Major resistance / neckline: $0.095–$0.110
🚀 Next major upside zone: $0.18–$0.25
⚠️ Structure invalidation: Below ~$0.040
What matters now?
The real confirmation comes if $SAND can achieve a daily close above $0.095–$0.110 with strong volume and then successfully hold that zone as support.
A rejection from this resistance could bring a pullback/retest toward the breakout area before another attempt.
My chart structure:
Long-term downtrend → accumulation → breakout attempt → resistance test.
Not financial advice. Always manage risk. 📈
#sand #TheSandbox #TheSandbox #CryptoTrends2024 #BinanceSquareTalks #Altcoins #CryptoTrading #TechnicalAnalysis #Trading #Web3 #GameFi #BinanceSquare