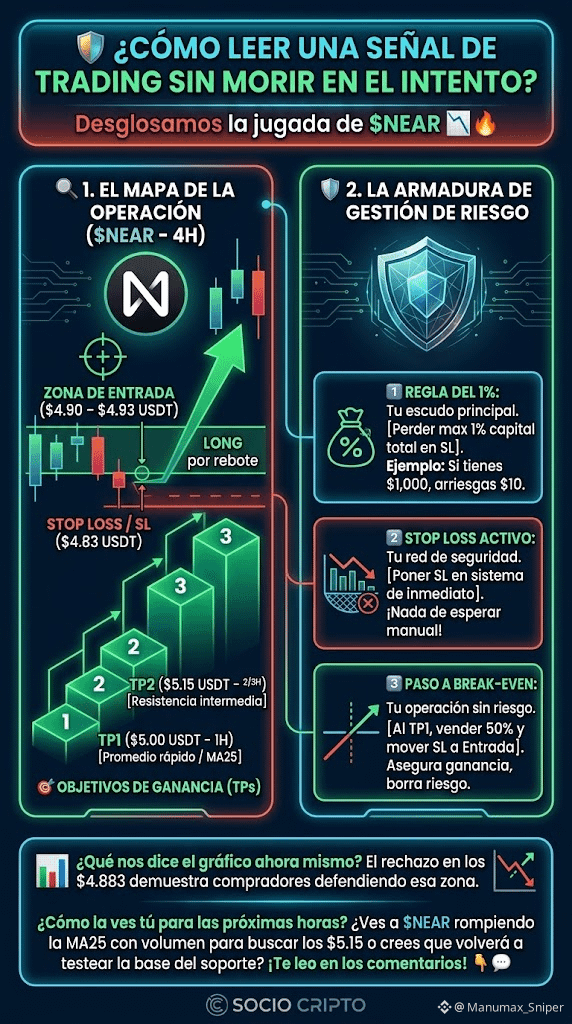
How to read a trading signal without dying in the attempt? We break down the play of $NEAR 📉🔥
Family, coffee in hand. People always ask me: “Bro, I see your numbers and your plans, but what does each term really mean?”
Today we’re not here to throw data around for no reason. Let’s use the tactical plan we built for $NEAR on 4H and translate it point by point so you understand the why behind every parameter. Nobody here trades blind.
🔍 1. The elements of the trade (The Map)
🔹 Asset and Timeframe ($NEAR - 4H): It means we evaluate the NEAR cryptocurrency by looking at candles where each one represents 4 hours of trading. It’s the ideal chart to filter out daily noise and see where institutional volume is heading.
🟢 Main Plan (LONG on a bounce): “Long” is a buy trade. We wait for the price to touch a key zone and react upward.
📍 Entry Zone ($4.90 – $4.93 USDT): This is our shooting range. We don’t buy anywhere; we wait for the price to fall into this dynamic support range (where buyers typically defend the price) so we can position ourselves at the best possible price.
🛑 Stop Loss / SL ($4.83 USDT): Our safety net. If the price drops below this level, the technical idea is invalidated. We cut the loss immediately and exit the market. Anyone who trades without an SL isn’t doing trading—they’re gambling.
🎯 Take Profit Targets (TP1, TP2, TP3):
TP1 ($5.00 USDT - 1H): First technical milestone (retest to the 25-period average). Here the price finds a small pause.
TP2 ($5.15 USDT - 2/3H): Intermediate resistance. If it clears the MA25, momentum usually accelerates up to this level.
TP3 ($5.35 USDT - 4H): The targeted upper zone, right before the prior local high ($5.578).
Family, coffee in hand. People always ask me: “Bro, I see your numbers and your plans, but what does each term really mean?”
Today we’re not here to throw data around for no reason. Let’s use the tactical plan we built for $NEAR on 4H and translate it point by point so you understand the why behind every parameter. Nobody here trades blind.
🔍 1. The elements of the trade (The Map)
🔹 Asset and Timeframe ($NEAR - 4H): It means we evaluate the NEAR cryptocurrency by looking at candles where each one represents 4 hours of trading. It’s the ideal chart to filter out daily noise and see where institutional volume is heading.
🟢 Main Plan (LONG on a bounce): “Long” is a buy trade. We wait for the price to touch a key zone and react upward.
📍 Entry Zone ($4.90 – $4.93 USDT): This is our shooting range. We don’t buy anywhere; we wait for the price to fall into this dynamic support range (where buyers typically defend the price) so we can position ourselves at the best possible price.
🛑 Stop Loss / SL ($4.83 USDT): Our safety net. If the price drops below this level, the technical idea is invalidated. We cut the loss immediately and exit the market. Anyone who trades without an SL isn’t doing trading—they’re gambling.
🎯 Take Profit Targets (TP1, TP2, TP3):
TP1 ($5.00 USDT - 1H): First technical milestone (retest to the 25-period average). Here the price finds a small pause.
TP2 ($5.15 USDT - 2/3H): Intermediate resistance. If it clears the MA25, momentum usually accelerates up to this level.
TP3 ($5.35 USDT - 4H): The targeted upper zone, right before the prior local high ($5.578).