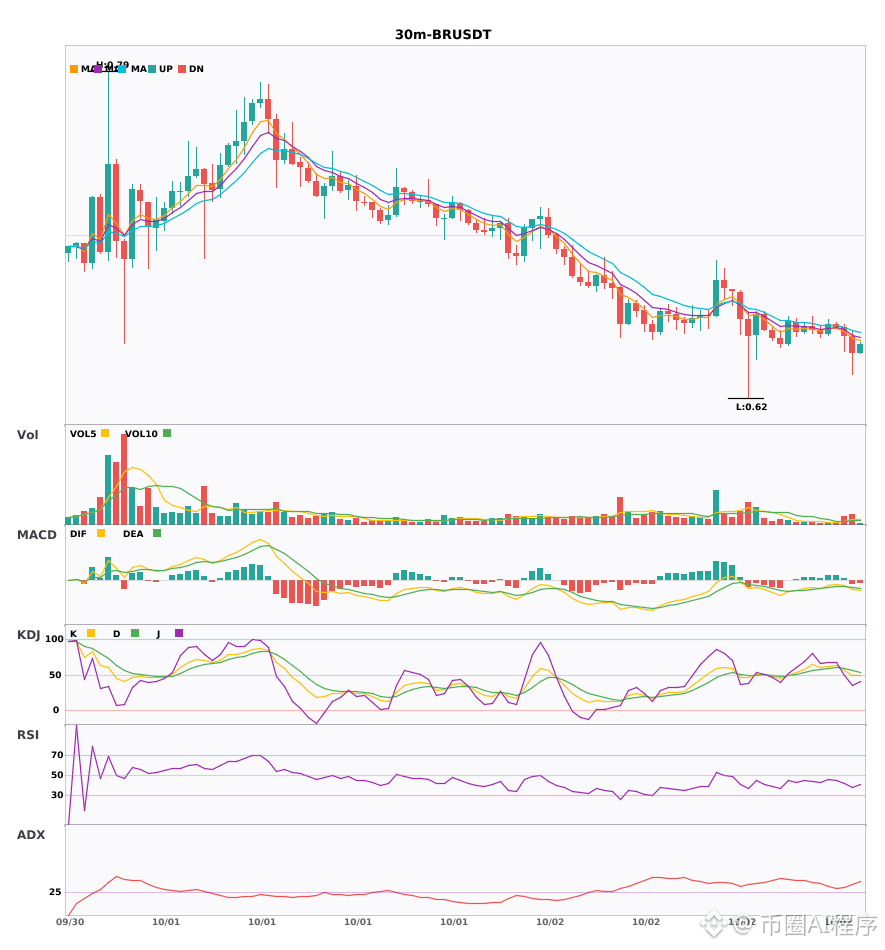
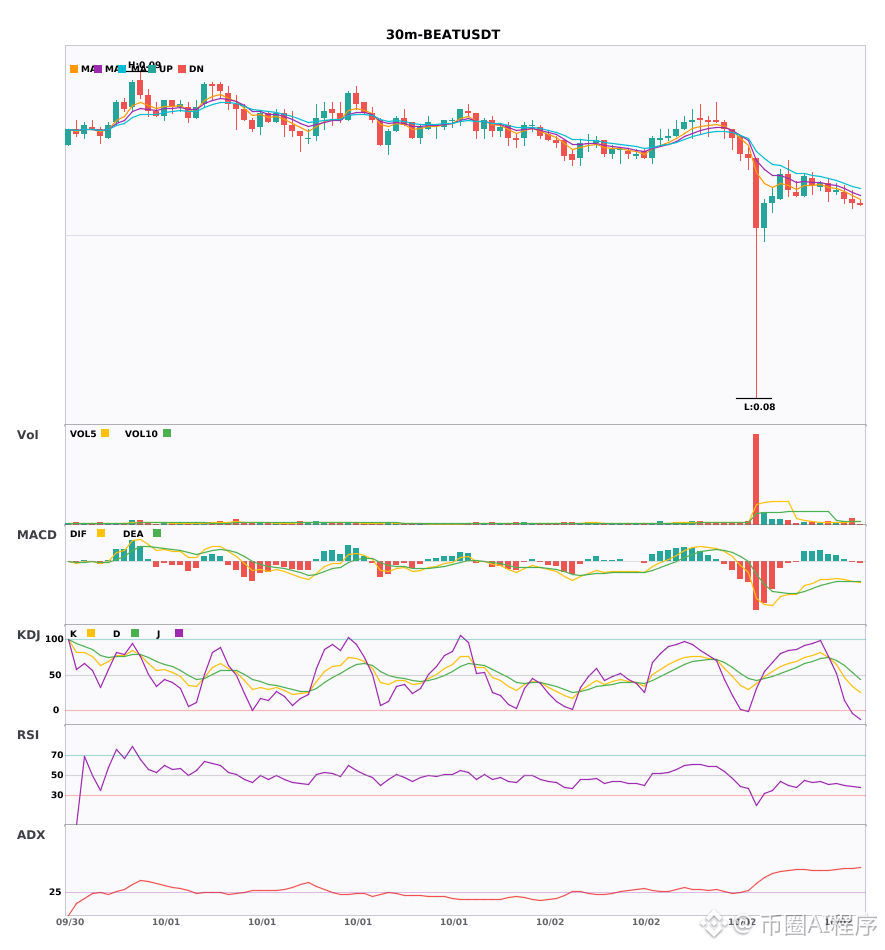
$BR /$BEAT 30 minutes dead cross green histogram amplification, 4-hour moving averages short-side divergence downward🔥
════════════════════
🟢 $BR 30 minutes bearish signal
⚠️ Technical analysis: 4-hour bearish + 30-minute bearish resonance confirmation! The 30-minute MACD forms a dead cross below zero with expanded histogram bars and the moving averages are arranged bearish and diverging downward; volume is up by 2.4x, and the bearish signal is clear.
════════════════════
🟢 $BEAT 30 minutes bearish signal
⚠️ Technical analysis: 4-hour bearish and 30-minute resonance confirmation! After the 30-minute MACD dead cross, the green histogram bars expand; the moving averages’ bearish arrangement diverges downward, and volume increases by about 1.8x
════════════════════
🔔 Follow to get the first-hand market anomaly 🔔
#多周期共振 #BR #BEAT
📌 When trading, pay attention to whether the candlestick pattern matches
════════════════════
🟢 $BR 30 minutes bearish signal
⚠️ Technical analysis: 4-hour bearish + 30-minute bearish resonance confirmation! The 30-minute MACD forms a dead cross below zero with expanded histogram bars and the moving averages are arranged bearish and diverging downward; volume is up by 2.4x, and the bearish signal is clear.
════════════════════
🟢 $BEAT 30 minutes bearish signal
⚠️ Technical analysis: 4-hour bearish and 30-minute resonance confirmation! After the 30-minute MACD dead cross, the green histogram bars expand; the moving averages’ bearish arrangement diverges downward, and volume increases by about 1.8x
════════════════════
🔔 Follow to get the first-hand market anomaly 🔔
#多周期共振 #BR #BEAT
📌 When trading, pay attention to whether the candlestick pattern matches