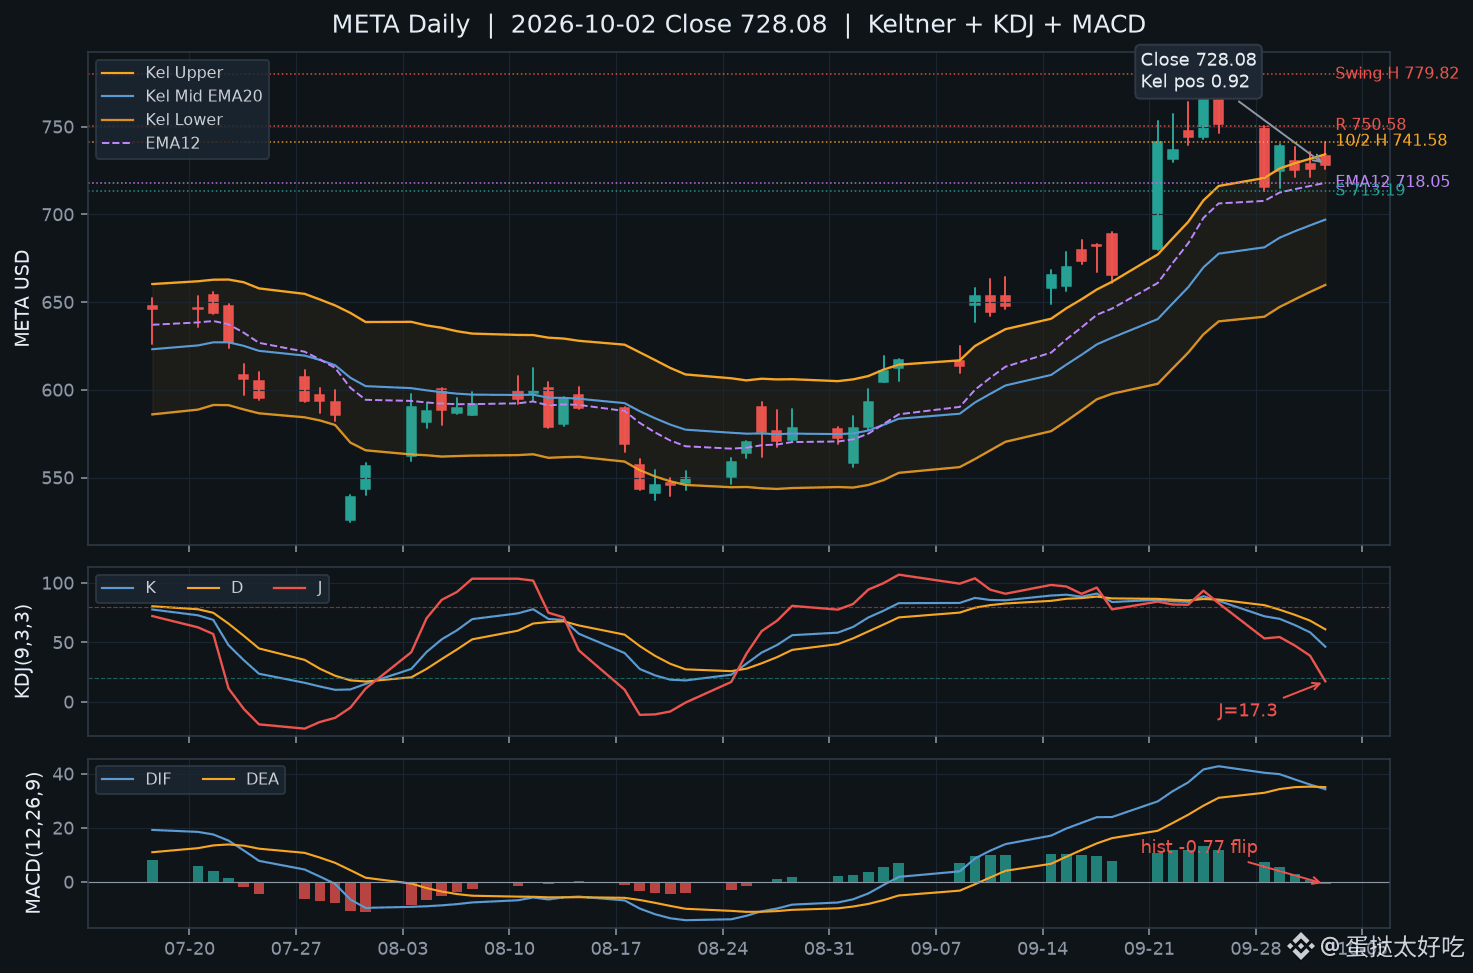
The close was green by 0.3%, but during the session it nearly got wiped out after tagging 741.58—this “false strength” in $META is the key focus of the 10/2 cash trading board.
Daily OHLC: 733.21/741.58/726.20/728.08, down about 0.70% from the open, with an upper wick around 8.4. Keltner (EMA20, ATR20×1.5): middle band 697.06 / upper band 734.28 / lower band 659.85; ATR20 = 24.81. Close position in the channel ≈ 0.92—price is still near the upper band. KDJ(9,3,3): K=46.4 / D=61.0 / J=17.3; J has already dropped into a weak zone. MACD(12,26,9): DIF=34.31 / DEA=35.08 / histogram=-0.77 (prior value +0.76); the histogram line has just flipped to negative.
Structurally: after the 9/24 swing high at 779.82, it kept printing lower highs (LH). The 10/2 high at 741.58 failed to hold, and then the 9/28 high at 750.58 was lost. For support, first look at EMA12 around 718, then the area near the 9/28 low around 713. If 713 breaks, the “pullback then bounce” narrative loosens; only after reclaiming 741 do we talk about challenging 750 again.
Price is still hugging the upper edge of the channel and the moving-average trend isn’t broken—yet the momentum indicators are loosening first. This could mean grinding at the top continues, or it could mean a pullback to digest at the middle band—either interpretation can be argued.
#美股 #META #Technical Analysis
Daily OHLC: 733.21/741.58/726.20/728.08, down about 0.70% from the open, with an upper wick around 8.4. Keltner (EMA20, ATR20×1.5): middle band 697.06 / upper band 734.28 / lower band 659.85; ATR20 = 24.81. Close position in the channel ≈ 0.92—price is still near the upper band. KDJ(9,3,3): K=46.4 / D=61.0 / J=17.3; J has already dropped into a weak zone. MACD(12,26,9): DIF=34.31 / DEA=35.08 / histogram=-0.77 (prior value +0.76); the histogram line has just flipped to negative.
Structurally: after the 9/24 swing high at 779.82, it kept printing lower highs (LH). The 10/2 high at 741.58 failed to hold, and then the 9/28 high at 750.58 was lost. For support, first look at EMA12 around 718, then the area near the 9/28 low around 713. If 713 breaks, the “pullback then bounce” narrative loosens; only after reclaiming 741 do we talk about challenging 750 again.
Price is still hugging the upper edge of the channel and the moving-average trend isn’t broken—yet the momentum indicators are loosening first. This could mean grinding at the top continues, or it could mean a pullback to digest at the middle band—either interpretation can be argued.
#美股 #META #Technical Analysis