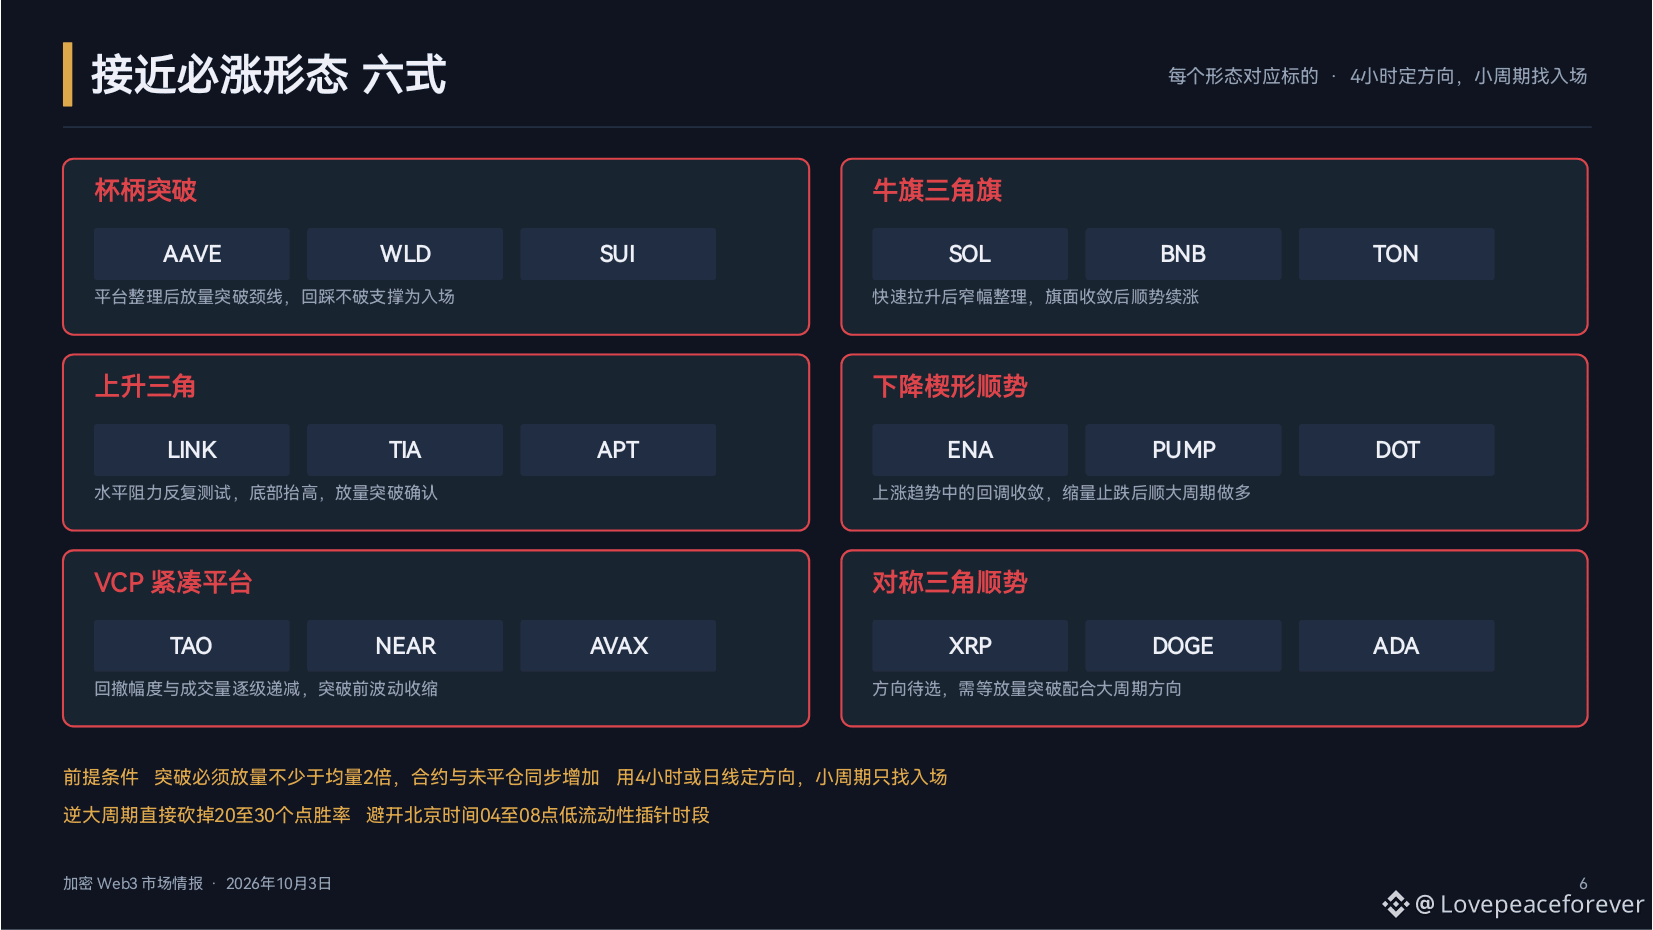
Approaching the Break-Down Reversal Pattern
Prerequisites: Focus on the quality of the rebound rather than the breakout volume. The less volume there is on the rebound, the better—if it fails around the EMA20 or at the neckline, that’s a bearish signal. If the funding rate turns negative and open interest increases, it suggests the downtrend is building up; however, if the funding rate is already deeply negative (oversold), don’t chase short. Only take short opportunities at the end of a rebound when the 4-hour chart has already turned bearish; don’t short during a bullish trend’s minor pullbacks.
Bear Flag or Falling Triangle: $ZEC 、TIA、$ENA
ZEC dropped quickly from $1494 to $1292. The 4-hour chart shows a bearish alignment; a rebound to around $1412 forms a bear flag if there is no volume. A break below $1271 will accelerate the move. TIA is bearish on the 4-hour chart; it rebounds to the $0.45–$0.46 resistance zone, where the probability of rejection is high. ENA is weak on the 4-hour chart; a rebound to around $0.25 is near the neckline resistance.
Descending Triangle Breakdown: $HYPE、$LINK、$TAO
HYPE has already turned bearish on the 4-hour chart. It forms descending pressure in the $91–$95 range; once it breaks above $84.6, downward space opens up. LINK breaks below the short-term moving average; $14.65 is the rebound neckline. A break below $13.15 accelerates the decline. TAO slid from its $341 high; $282 is the key support. After breaking it, price may test even lower levels.
Prerequisites: Focus on the quality of the rebound rather than the breakout volume. The less volume there is on the rebound, the better—if it fails around the EMA20 or at the neckline, that’s a bearish signal. If the funding rate turns negative and open interest increases, it suggests the downtrend is building up; however, if the funding rate is already deeply negative (oversold), don’t chase short. Only take short opportunities at the end of a rebound when the 4-hour chart has already turned bearish; don’t short during a bullish trend’s minor pullbacks.
Bear Flag or Falling Triangle: $ZEC 、TIA、$ENA
ZEC dropped quickly from $1494 to $1292. The 4-hour chart shows a bearish alignment; a rebound to around $1412 forms a bear flag if there is no volume. A break below $1271 will accelerate the move. TIA is bearish on the 4-hour chart; it rebounds to the $0.45–$0.46 resistance zone, where the probability of rejection is high. ENA is weak on the 4-hour chart; a rebound to around $0.25 is near the neckline resistance.
Descending Triangle Breakdown: $HYPE、$LINK、$TAO
HYPE has already turned bearish on the 4-hour chart. It forms descending pressure in the $91–$95 range; once it breaks above $84.6, downward space opens up. LINK breaks below the short-term moving average; $14.65 is the rebound neckline. A break below $13.15 accelerates the decline. TAO slid from its $341 high; $282 is the key support. After breaking it, price may test even lower levels.