Approaching “Must-Rise” Pattern
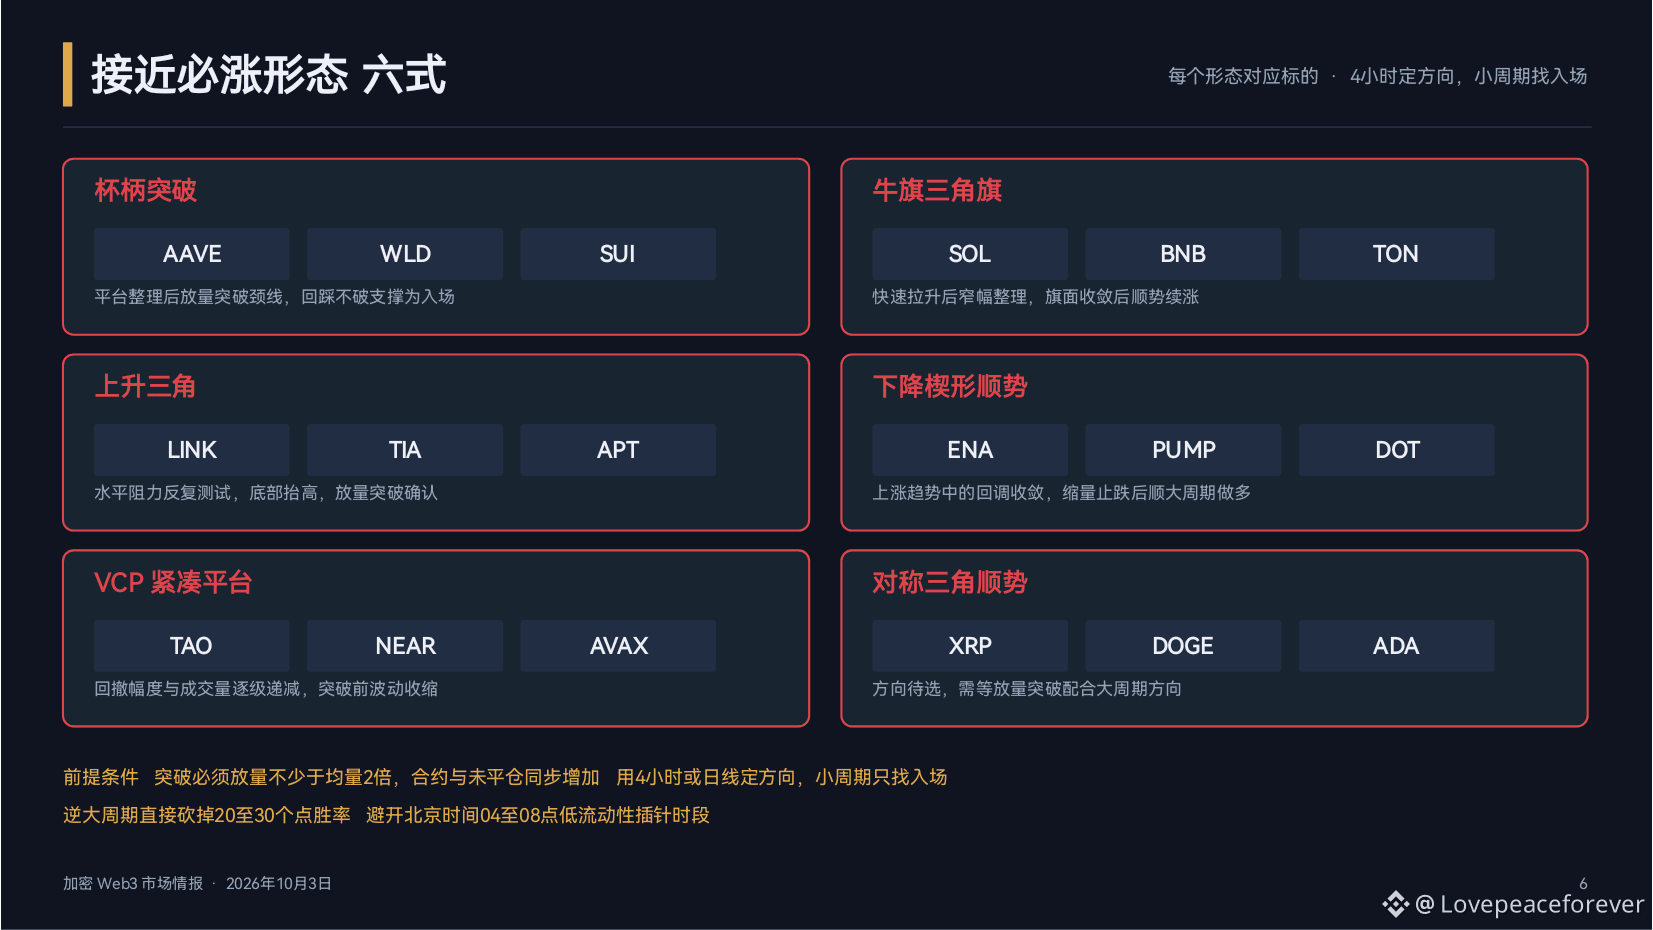
Prerequisites: The breakout must come with volume at least 2x the average; the contract and open interest increase at the same time. Use the 4-hour or daily chart to determine direction—smaller timeframes are only for finding the entry. If the breakout goes against the larger timeframe trend, cut it immediately for a 20–30 point loss (based on winning probability). Avoid low-liquidity “needle” periods between 04:00 and 08:00 Beijing time.
Cup-and-Handle Breakout: $AAVE , $WLD, $SUI
AAVE forms a base around $180 under a governance-proposal catalyst. Both the daily and 4-hour charts are in a bullish alignment. If it holds above $187.5 and breaks out with increased volume, that is the signal; support is at $170.8. WLD forms an upward structure in the $0.50 to $0.59 range; volume rises moderately. This is a narrative-driven platform breakout pattern, with support at $0.499. SUI has recently pulled back to $1.1267. The daily MA50 near $1.126 provides support. If it stabilizes on reduced volume and regains $1.22 with volume in the $1.10 to $1.13 range, it forms a handle structure after the pullback.
Bull Flags or Symmetrical Triangles: SOL, $BNB, $TON
SOL consolidates horizontally after the $124.9 high, with the flag area ranging from $117 to $124. Daily MA20 at $113 forms support for the flagpole; a breakout above $124.9 with volume is the signal. BNB consolidates between $750 and $784; price is close to MA20 around $760, forming a tight flag pattern. A breakout above $807 confirms the prior high. TON is consolidating narrowly between $1.58 and $1.64 with contracting volume; it’s a small time-frame flag—watch the direction of any volume expansion.
Rising Triangle: $LINK, $TIA , $APT
LINK repeatedly tests the $13 to $14 range; the horizontal support gradually lifts. If it breaks above $14.65 with volume, the pattern is confirmed. TIA forms a bottom-lifting structure in the $0.42 to $0.49 range; a short-term rise of 2.87% suggests capital probing back in. APT fluctuates between $0.77 and $0.85; intraday it’s up 1.31% relative to outperforming versus the decline—look for a breakout above $0.85 with volume.
Falling Wedge Trend-Following: $ENA, $PUMP, $DOT
ENA drops from $0.29 to $0.23, a decline of 4.77%. The wedge is converging; if it compresses volume near $0.227 to stop the fall and rebounds with increased volume, that creates a trend-following opportunity. PUMP pulls back from $0.0062 to $0.0054, down 7.63%; it is a retracement wedge within an uptrend, with support at $0.0051. DOT consolidates within $1.14 to $1.24; watch whether the $1.138 support holds effectively.
Prerequisites: The breakout must come with volume at least 2x the average; the contract and open interest increase at the same time. Use the 4-hour or daily chart to determine direction—smaller timeframes are only for finding the entry. If the breakout goes against the larger timeframe trend, cut it immediately for a 20–30 point loss (based on winning probability). Avoid low-liquidity “needle” periods between 04:00 and 08:00 Beijing time.
Cup-and-Handle Breakout: $AAVE , $WLD, $SUI
AAVE forms a base around $180 under a governance-proposal catalyst. Both the daily and 4-hour charts are in a bullish alignment. If it holds above $187.5 and breaks out with increased volume, that is the signal; support is at $170.8. WLD forms an upward structure in the $0.50 to $0.59 range; volume rises moderately. This is a narrative-driven platform breakout pattern, with support at $0.499. SUI has recently pulled back to $1.1267. The daily MA50 near $1.126 provides support. If it stabilizes on reduced volume and regains $1.22 with volume in the $1.10 to $1.13 range, it forms a handle structure after the pullback.
Bull Flags or Symmetrical Triangles: SOL, $BNB, $TON
SOL consolidates horizontally after the $124.9 high, with the flag area ranging from $117 to $124. Daily MA20 at $113 forms support for the flagpole; a breakout above $124.9 with volume is the signal. BNB consolidates between $750 and $784; price is close to MA20 around $760, forming a tight flag pattern. A breakout above $807 confirms the prior high. TON is consolidating narrowly between $1.58 and $1.64 with contracting volume; it’s a small time-frame flag—watch the direction of any volume expansion.
Rising Triangle: $LINK, $TIA , $APT
LINK repeatedly tests the $13 to $14 range; the horizontal support gradually lifts. If it breaks above $14.65 with volume, the pattern is confirmed. TIA forms a bottom-lifting structure in the $0.42 to $0.49 range; a short-term rise of 2.87% suggests capital probing back in. APT fluctuates between $0.77 and $0.85; intraday it’s up 1.31% relative to outperforming versus the decline—look for a breakout above $0.85 with volume.
Falling Wedge Trend-Following: $ENA, $PUMP, $DOT
ENA drops from $0.29 to $0.23, a decline of 4.77%. The wedge is converging; if it compresses volume near $0.227 to stop the fall and rebounds with increased volume, that creates a trend-following opportunity. PUMP pulls back from $0.0062 to $0.0054, down 7.63%; it is a retracement wedge within an uptrend, with support at $0.0051. DOT consolidates within $1.14 to $1.24; watch whether the $1.138 support holds effectively.