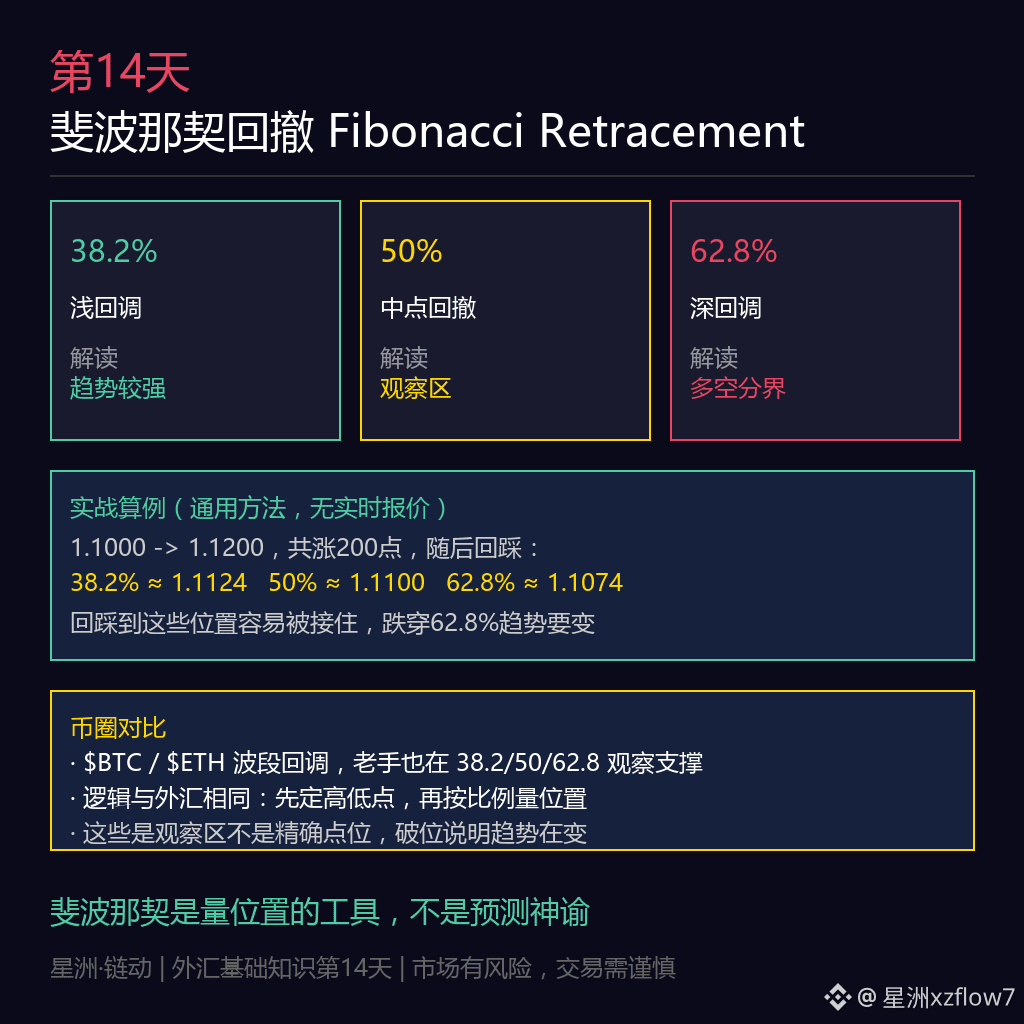
Day 14: Forex Basics — Fibonacci Retracement
Price rises for a while, then falls for a while—where does a pullback tend to get picked up?
The answer lies in a few key Fibonacci retracement ratios: 38.2%, 50%, and 62.8%.
How to draw it?
Step 1: Identify the high and low points of a complete swing (use the leg that goes up then down).
Step 2: Using the total swing range of that move, pull back by the chosen ratios to draw the retracement lines.
Practical example (general method, no live quotes):
Suppose a currency pair rises from 1.1000 to 1.1200—an advance of 200 pips—then pulls back:
- 38.2% retracement = 1.1200 − 200 × 0.382 ≈ 1.1124
- 50% retracement ≈ 1.1100
- 62.8% retracement ≈ 1.1074
These three levels naturally form observation zones:
· 38.2% — a shallow retracement; bulls are still relatively strong
· 62.8% — a deeper retracement; the line between buyers and sellers becomes more sensitive
· If price breaks below 62.8% (or even above 70%), the trend is likely to change
Crypto comparison (30%):
For $BTC , $ETH swing retracements, even experienced traders also watch support around 38.2% / 50% / 62.8%.
The logic is exactly the same as in forex: first mark the high and low of a swing, then measure the position using the ratios.
Note: these are observation zones, not exact prices—if they break, it means the trend is changing, not that you should stubbornly hold on.
Remember: Fibonacci is a tool for measuring positions, not a crystal ball or oracle. Use it together with the trend.
Market risk exists; trade with caution. The above content is for educational purposes only and does not constitute investment advice.
Price rises for a while, then falls for a while—where does a pullback tend to get picked up?
The answer lies in a few key Fibonacci retracement ratios: 38.2%, 50%, and 62.8%.
How to draw it?
Step 1: Identify the high and low points of a complete swing (use the leg that goes up then down).
Step 2: Using the total swing range of that move, pull back by the chosen ratios to draw the retracement lines.
Practical example (general method, no live quotes):
Suppose a currency pair rises from 1.1000 to 1.1200—an advance of 200 pips—then pulls back:
- 38.2% retracement = 1.1200 − 200 × 0.382 ≈ 1.1124
- 50% retracement ≈ 1.1100
- 62.8% retracement ≈ 1.1074
These three levels naturally form observation zones:
· 38.2% — a shallow retracement; bulls are still relatively strong
· 62.8% — a deeper retracement; the line between buyers and sellers becomes more sensitive
· If price breaks below 62.8% (or even above 70%), the trend is likely to change
Crypto comparison (30%):
For $BTC , $ETH swing retracements, even experienced traders also watch support around 38.2% / 50% / 62.8%.
The logic is exactly the same as in forex: first mark the high and low of a swing, then measure the position using the ratios.
Note: these are observation zones, not exact prices—if they break, it means the trend is changing, not that you should stubbornly hold on.
Remember: Fibonacci is a tool for measuring positions, not a crystal ball or oracle. Use it together with the trend.
Market risk exists; trade with caution. The above content is for educational purposes only and does not constitute investment advice.