

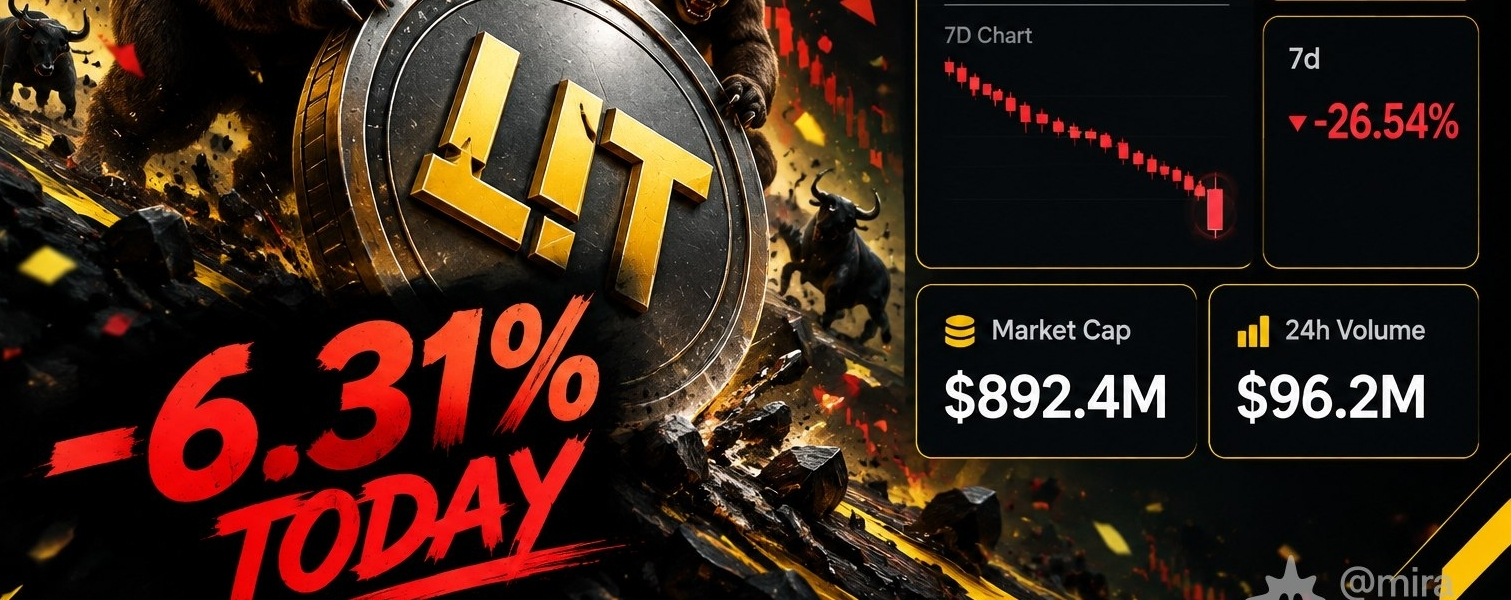

The chart doesn’t lie: -6.31% in 24h and a -26.54% drop over the last 7 days. Market cap is back to $892.4M with a daily volume of $96.2M. But beyond the numbers, what’s really happening behind the scenes?
🔍 The technical diagnosis:
We are not seeing a loss of organic adoption, but a direct impact from liquidity and market structure:
* Routing and liquidity: Operational changes in the futures flow in the U.S. and platforms like Robinhood altered institutional liquidity, triggering spot sell-offs and higher slippage.
* The Unlock factor: Reports point to a nearby unlock of around ~$52M in tokens. In a weak demand environment, incremental supply adds pressure.
* Buybacks underway: Active burns and repurchases help cushion dilution, but the key will be the execution pace over the medium term.
📉 Key levels to monitor:
* Supports: $3.00 (immediate) ➡️ $2.40 (second defensive floor).
* Resistances: $4.50 (recovery zone) ➡️ $5.80 (to flip the bias bullish).
💡 Conclusion: The market is in a fragile zone and depends on external flow. Managing circulating supply and partner announcements will dictate the next move.
How do you see this pullback? Is it an accumulation zone at the $3.00 support, or would you rather wait for volume confirmation? 📊👇
