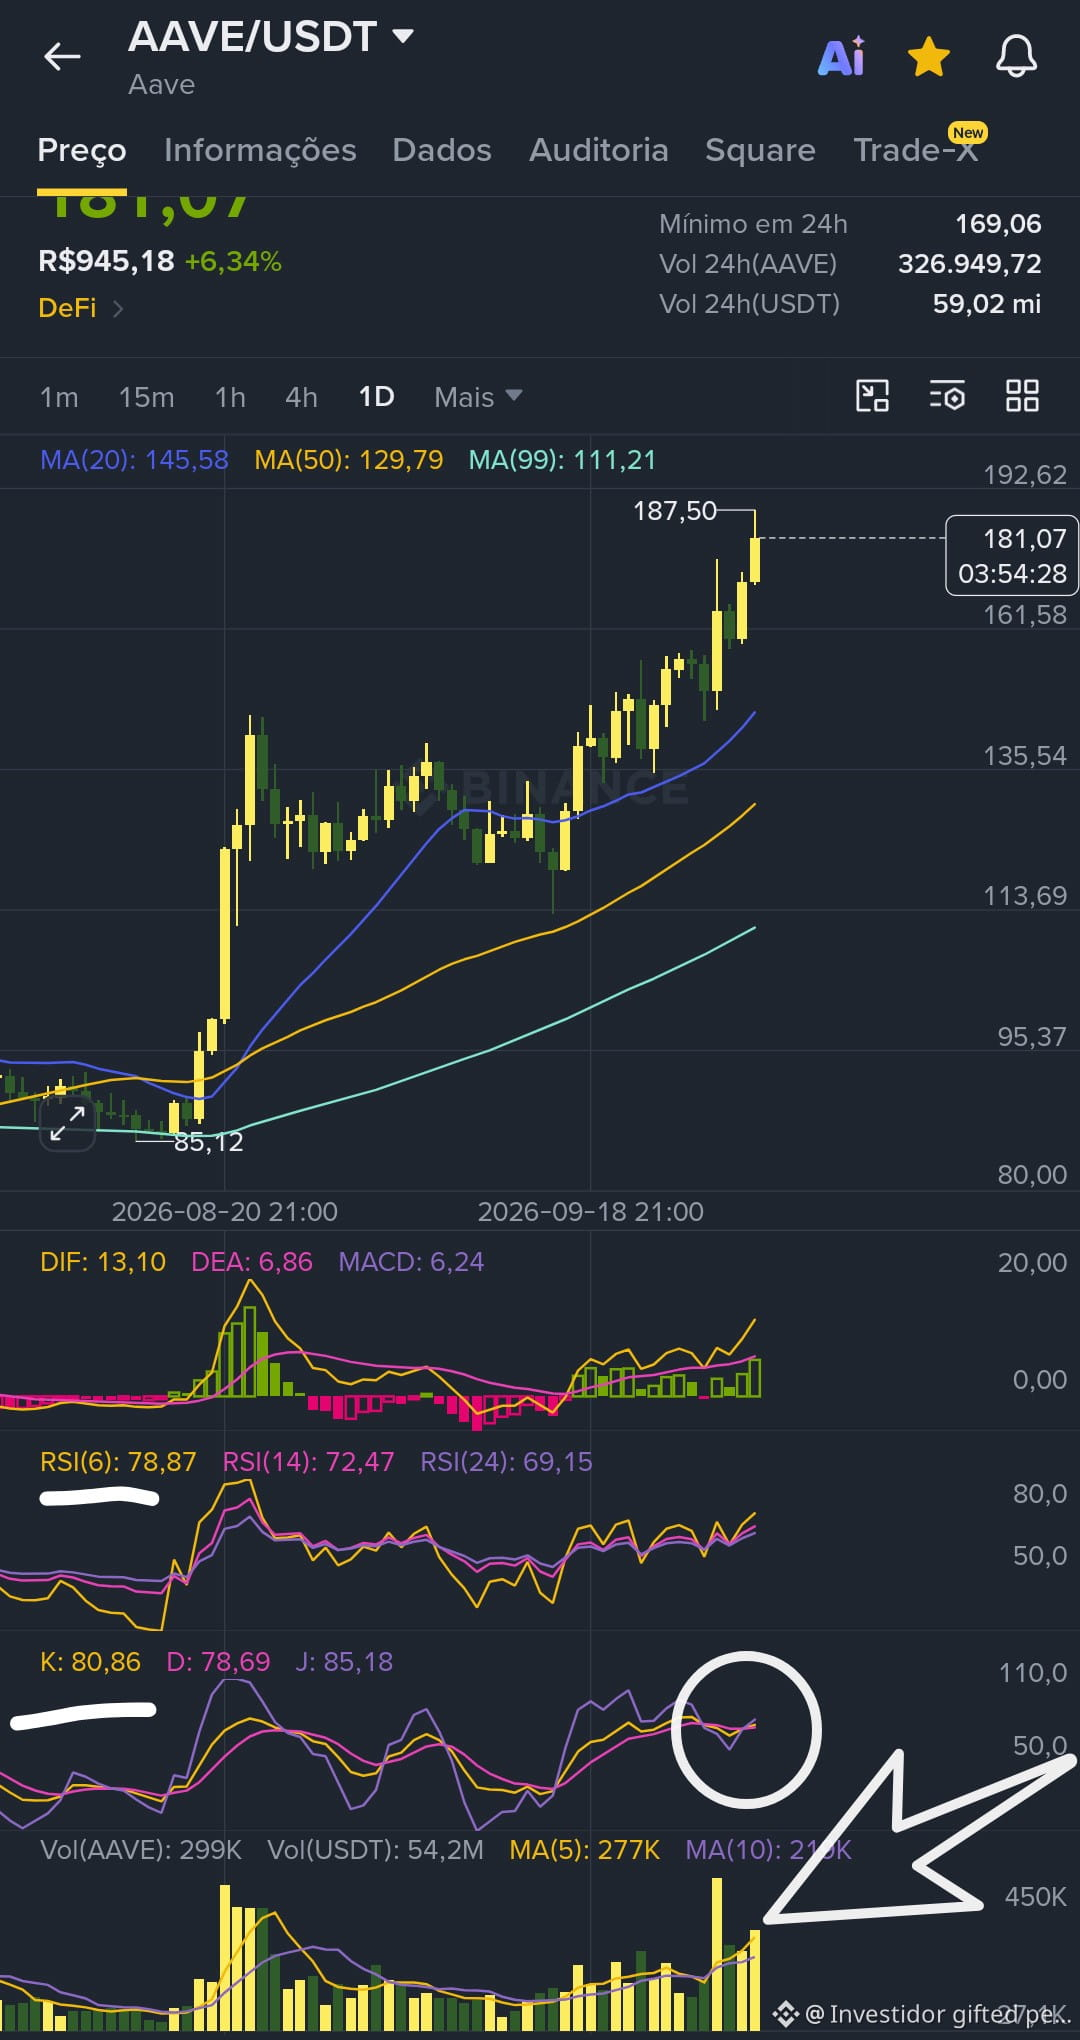
$AAVE : RSI in overbought condition and strong buying pressure
AAVE shows a strongly bullish structure on the daily chart.
The price is at US$ 181.07, up 6.34%, staying above the moving averages:
MA20: US$ 145.58
MA50: US$ 129.79
MA99: US$ 111.21
The key point is the RSI:
RSI(6): 78.87
RSI(14): 72.47
Both are above 70, confirming an overbought condition. The indicator shows that the buying move has gained strong intensity and also increases the risk of consolidation or a short-term correction.
Even with the elevated RSI, the structure remains bullish: price is above the moving averages, the bottoms and tops continue to rise, and the former resistance at US$ 161.58 has been broken.
Volume also confirms the strength of the move. The volume of approximately 299K AAVE is higher than the 5-period average, around 277K, reinforcing the breakout.
MACD remains positive, with DIF at 13.10, DEA at 6.86, and histogram at +6.24. KDJ also stays in an elevated region, with K at 80.86, D at 78.69, and J at 85.18.
Immediate resistance is at US$ 187.50–189.00.
A daily close above US$ 187.50 with increasing volume confirms the break of this barrier and puts US$ 200–208 as the next resistance zone.
In a correction, US$ 175–170 is the first support. US$ 161.58 is the most important structural support, as it was the prior resistance that was broken.
As long as US$ 161.58 remains preserved on the daily close, the bullish structure stays intact.
AAVE is strong. The RSI shows an extreme acceleration of the move, while price, volume, moving averages, and MACD remain aligned with the buying trend.
There’s a lot of room for it to run.
Did you notice that already?
#ALTCOİNS
AAVE shows a strongly bullish structure on the daily chart.
The price is at US$ 181.07, up 6.34%, staying above the moving averages:
MA20: US$ 145.58
MA50: US$ 129.79
MA99: US$ 111.21
The key point is the RSI:
RSI(6): 78.87
RSI(14): 72.47
Both are above 70, confirming an overbought condition. The indicator shows that the buying move has gained strong intensity and also increases the risk of consolidation or a short-term correction.
Even with the elevated RSI, the structure remains bullish: price is above the moving averages, the bottoms and tops continue to rise, and the former resistance at US$ 161.58 has been broken.
Volume also confirms the strength of the move. The volume of approximately 299K AAVE is higher than the 5-period average, around 277K, reinforcing the breakout.
MACD remains positive, with DIF at 13.10, DEA at 6.86, and histogram at +6.24. KDJ also stays in an elevated region, with K at 80.86, D at 78.69, and J at 85.18.
Immediate resistance is at US$ 187.50–189.00.
A daily close above US$ 187.50 with increasing volume confirms the break of this barrier and puts US$ 200–208 as the next resistance zone.
In a correction, US$ 175–170 is the first support. US$ 161.58 is the most important structural support, as it was the prior resistance that was broken.
As long as US$ 161.58 remains preserved on the daily close, the bullish structure stays intact.
AAVE is strong. The RSI shows an extreme acceleration of the move, while price, volume, moving averages, and MACD remain aligned with the buying trend.
There’s a lot of room for it to run.
Did you notice that already?
#ALTCOİNS