Ethereum spot ETFs are bleeding again.
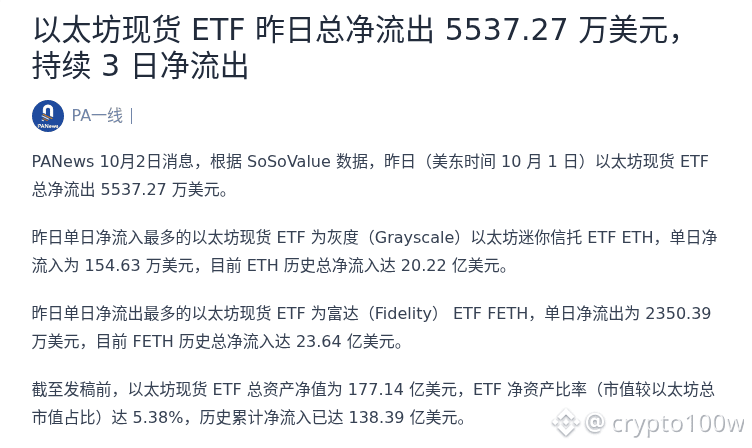
PANews reports that on October 1, Ethereum spot ETFs saw total net outflows of $55.3727 million, marking 3 consecutive days of net outflows. Among them, Fidelity’s ETF FETH recorded a single-day net outflow of $23.5039 million, while Grayscale’s Ethereum mini trust ETF ETH had a single-day net inflow of $1.5463 million.
These types of fund flow changes suggest at least two things: first, the “backstop” buying power from spot buyers is weakening; second, institutions remain relatively cautious in the short term. What’s more worth watching next is whether ETF outflows will narrow, and whether spot volumes can absorb the selling pressure.
When you look at the charts, would you care more about “outflows continuing to expand,” or “single-day net inflows starting to rebound”?
Figure 1: Ethereum spot ETFs’ consecutive 3 days of net outflows · Source: partial screenshot of the page
Image source: https://www.panewslab.com/zh/articles/01a0faca-8524-73dc-a7ca-bd1e4beb01a5
PANews reports that on October 1, Ethereum spot ETFs saw total net outflows of $55.3727 million, marking 3 consecutive days of net outflows. Among them, Fidelity’s ETF FETH recorded a single-day net outflow of $23.5039 million, while Grayscale’s Ethereum mini trust ETF ETH had a single-day net inflow of $1.5463 million.
These types of fund flow changes suggest at least two things: first, the “backstop” buying power from spot buyers is weakening; second, institutions remain relatively cautious in the short term. What’s more worth watching next is whether ETF outflows will narrow, and whether spot volumes can absorb the selling pressure.
When you look at the charts, would you care more about “outflows continuing to expand,” or “single-day net inflows starting to rebound”?
Figure 1: Ethereum spot ETFs’ consecutive 3 days of net outflows · Source: partial screenshot of the page
Image source: https://www.panewslab.com/zh/articles/01a0faca-8524-73dc-a7ca-bd1e4beb01a5