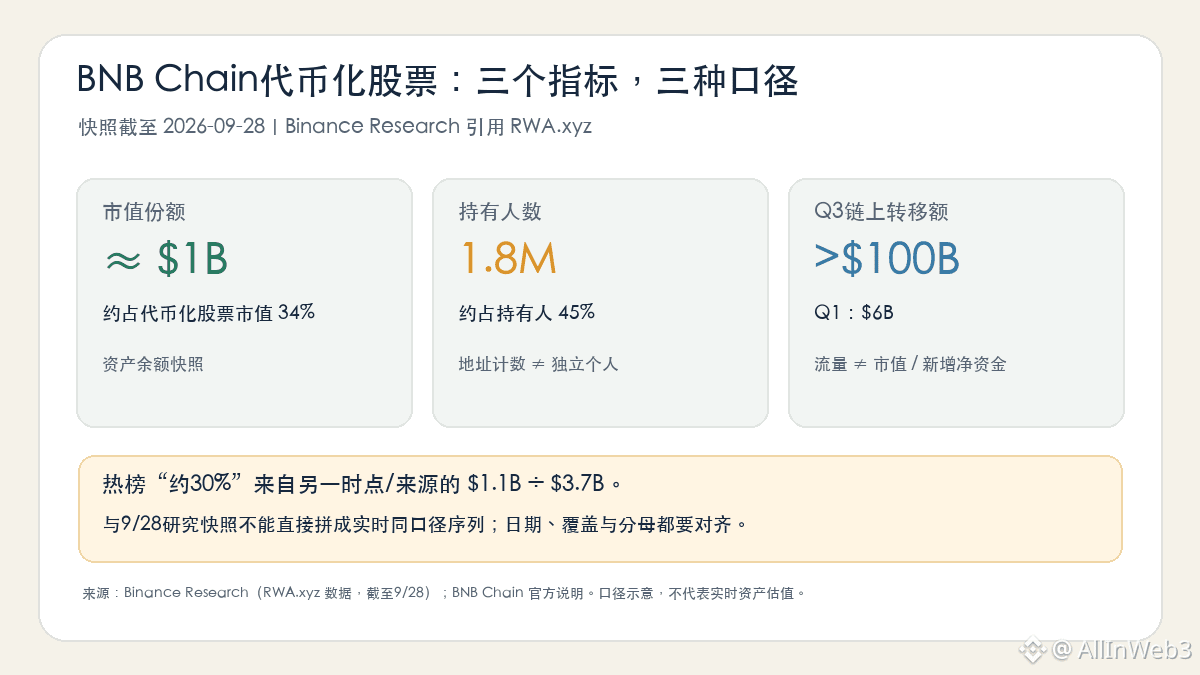
BNB Chain trending topic: “Tokenized stocks market value breaks $1 billion, about 30%.” The key is first to align the statistical cut-off times. In a report published by Binance Research on September 29, it cites RWA.xyz data with a cut-off of September 28: BNB Chain tokenized stock market value is about $1 billion, or 34%. On October 2, the media, using the Token Terminal methodology, quoted $1.1 billion / $3.7 billion globally, which works out to about 29.7%. These two sets of figures should not be stitched into a single real-time curve—the date, coverage scope, and denominator need to be examined separately.
This latest increment lies in breaking “market-value leadership” into three different metrics. Using the same cut-off, the report estimates BNB Chain has 1.8 million tokenized stock holders, or about 45% of the total; Q3 on-chain transfer volume exceeds $100 billion, while Q1 is about $6 billion. Market value is a point-in-time balance; the number of addresses is based on holding addresses; transfer volume is the in-period flow. None of the three can replace the others. High transfer volume does not necessarily mean the same amount of incremental purchases or net inflows; the number of addresses also does not equal 1.8 million independent users.
Structurally, it’s also not a single unified product. BNB Chain’s official materials list different issuance frameworks such as bStocks, Ondo Global Markets, and xStocks. For example, bStocks is supported by custody-backed underlying securities, but the specific rights, issuer, and applicable jurisdictions depend on the product documentation. Referring to on-chain certificates collectively as “stocks” can lead people to mistakenly assume holders are directly registered as shareholders of the listed company; in reality, you should verify redemption terms, custody arrangements, trading windows, and corporate action clauses.
Therefore, this milestone can indicate that tokenized stocks on BNB Chain have expanded in both balances and usage metrics—but it cannot, by market share alone, justify drawing conclusions about the real user count, liquidity quality, or the speed of traditional equity migration. Next, we should look at the market-value denominator, active address counts, and on-chain transfer de-duplication methodology using the same data source and the same cut-off date, as well as how much of the transfer volume is true trading versus cross-protocol transfers or repeated circulation. The data cut-off is mainly September 28, not real-time valuation at 00:44; the chart separates market value, holders, and transfer volume to prevent misreading.
This latest increment lies in breaking “market-value leadership” into three different metrics. Using the same cut-off, the report estimates BNB Chain has 1.8 million tokenized stock holders, or about 45% of the total; Q3 on-chain transfer volume exceeds $100 billion, while Q1 is about $6 billion. Market value is a point-in-time balance; the number of addresses is based on holding addresses; transfer volume is the in-period flow. None of the three can replace the others. High transfer volume does not necessarily mean the same amount of incremental purchases or net inflows; the number of addresses also does not equal 1.8 million independent users.
Structurally, it’s also not a single unified product. BNB Chain’s official materials list different issuance frameworks such as bStocks, Ondo Global Markets, and xStocks. For example, bStocks is supported by custody-backed underlying securities, but the specific rights, issuer, and applicable jurisdictions depend on the product documentation. Referring to on-chain certificates collectively as “stocks” can lead people to mistakenly assume holders are directly registered as shareholders of the listed company; in reality, you should verify redemption terms, custody arrangements, trading windows, and corporate action clauses.
Therefore, this milestone can indicate that tokenized stocks on BNB Chain have expanded in both balances and usage metrics—but it cannot, by market share alone, justify drawing conclusions about the real user count, liquidity quality, or the speed of traditional equity migration. Next, we should look at the market-value denominator, active address counts, and on-chain transfer de-duplication methodology using the same data source and the same cut-off date, as well as how much of the transfer volume is true trading versus cross-protocol transfers or repeated circulation. The data cut-off is mainly September 28, not real-time valuation at 00:44; the chart separates market value, holders, and transfer volume to prevent misreading.