$SAND short-term structure is weak. Stay on the sidelines first—don’t chase prices. This article only updates the drawdown after the post and the derivatives data.
In the complete 526/526 Binance U-margined USDT perpetual contract leaderboard at 00:06 Beijing time, $SAND ranked #2 by percentage gain, with a +39.687% 24-hour increase, quoted at 0.06156, and rolling trading volume of about 585 million USDT. At 00:07, the single-coin quote updated to 0.06131 (+38.962%).
Compared with the 22:07 snapshot cited in the most recent post from this account at 22:15 (0.06772, +58.9%, volume 464 million), the price has fallen another ~9.5%, and the gain has narrowed by nearly 19.9 percentage points—while trading volume has increased by about 26.2% again. This indicates trading is more active but the price is under pressure; rolling volume mixes buy and sell directions and can’t be treated as net buying.
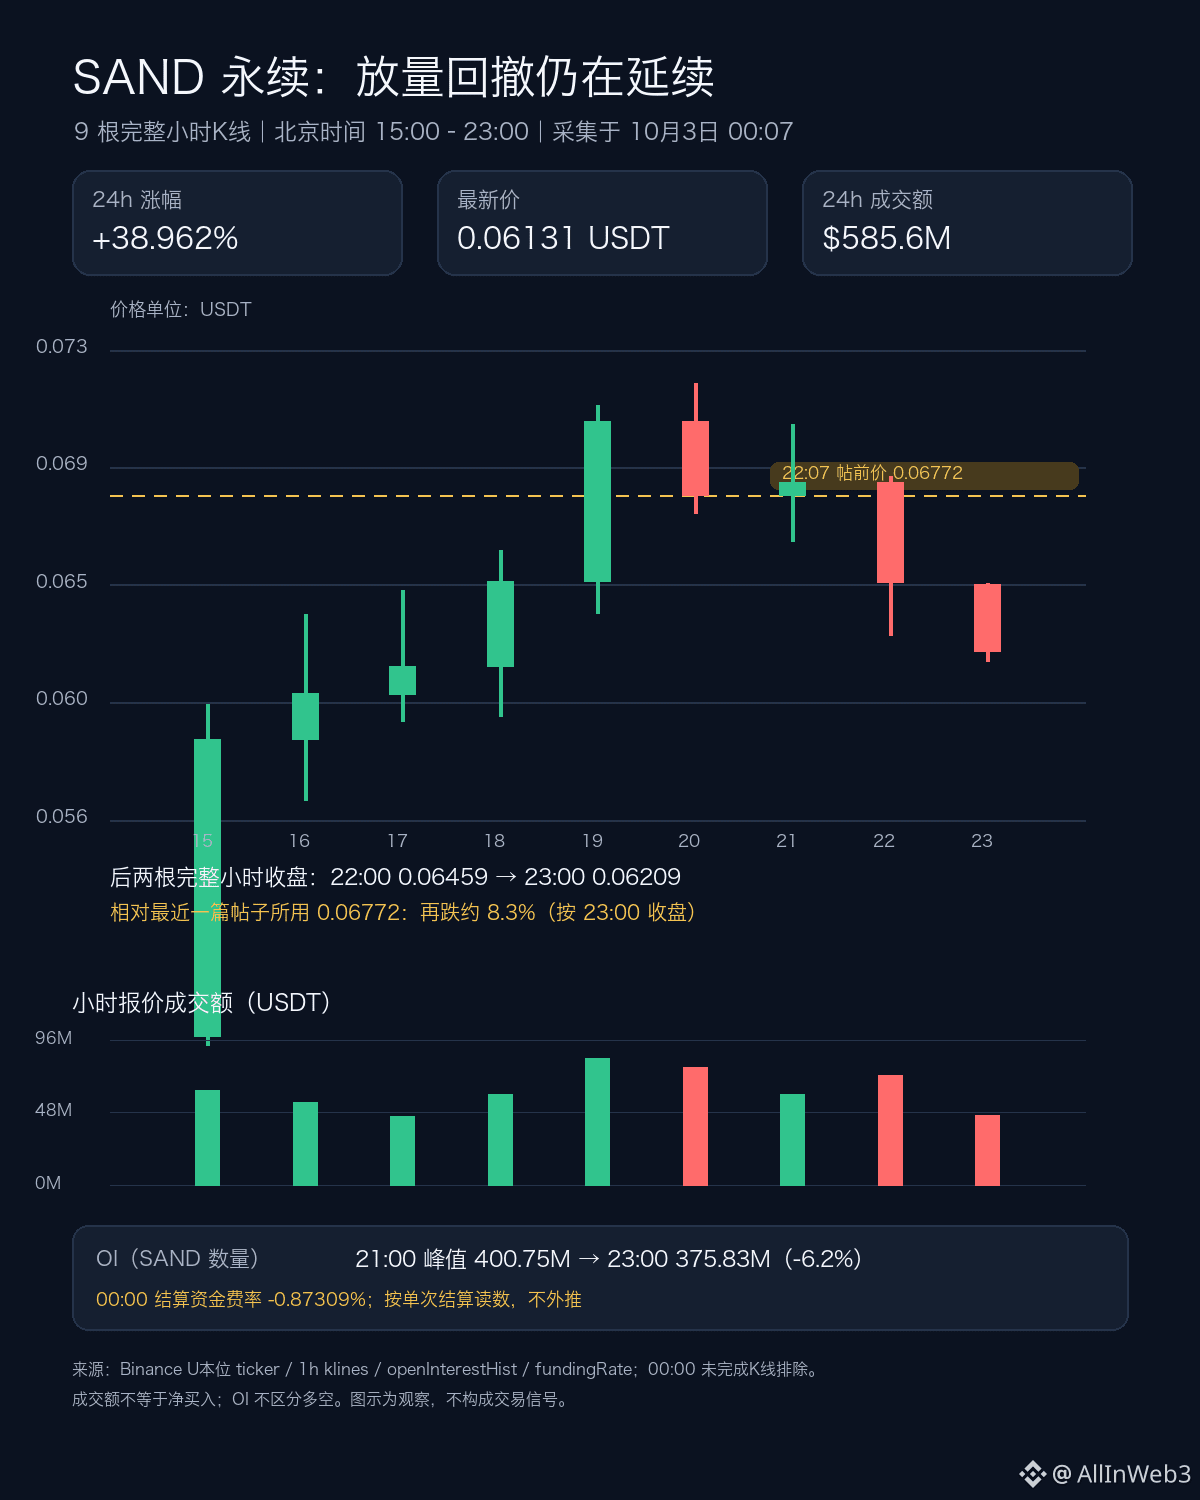
The newly completed hours ending at 22:00 and 23:00 closed at 0.06459 and 0.06209, respectively—both continuing lower. The 23:00 low was 0.06172. The 00:07 quote is already below that low, but the 00:00 hour has not closed yet, so an intraday break can’t be taken as an effective breakdown. The previous post stopped at the 21:00 structure; this incremental change comes from the downward shift of the last two completed hours, and the 4-hour K line from 20:00–00:00 closing at 0.06209, far below the current cycle high at 0.07179.
Open interest (OI) declined from the sample peak at around 400.75 million SAND at 21:00 to 375.83 million at 23:00, a drop of about 6.2%. Since OI doesn’t distinguish between longs and shorts, it can’t independently tell the closing direction. The 00:00 settlement funding rate is -0.87309%—this is just the funding reading for a single settlement. A negative funding rate means that at settlement, the flow pays in the direction of longs, so you can’t use it to judge the subsequent price direction, nor can it prove that shorts have been squeezed out. Searches of the project blog and Binance announcements didn’t find any new information that could explain this round of SAND volatility, so I don’t attribute the move to news.
Next, I will only watch two already-observed boundaries: whether the complete 00:00 hour can hold above 0.06172; and if a rebound occurs, whether it can get back above the vicinity of 0.06459. If it continues to break down, we still need to wait for the hour close and confirmation from the trade/volume structure. If it recovers, we also need to see whether it can be maintained—not just whether it’s pierced once. The above is an observation of the perpetual market, not a trading signal. The charts include only the nine completed hourly K lines from 15:00–23:00, excluding the incomplete 00:00 K line.
In the complete 526/526 Binance U-margined USDT perpetual contract leaderboard at 00:06 Beijing time, $SAND ranked #2 by percentage gain, with a +39.687% 24-hour increase, quoted at 0.06156, and rolling trading volume of about 585 million USDT. At 00:07, the single-coin quote updated to 0.06131 (+38.962%).
Compared with the 22:07 snapshot cited in the most recent post from this account at 22:15 (0.06772, +58.9%, volume 464 million), the price has fallen another ~9.5%, and the gain has narrowed by nearly 19.9 percentage points—while trading volume has increased by about 26.2% again. This indicates trading is more active but the price is under pressure; rolling volume mixes buy and sell directions and can’t be treated as net buying.
The newly completed hours ending at 22:00 and 23:00 closed at 0.06459 and 0.06209, respectively—both continuing lower. The 23:00 low was 0.06172. The 00:07 quote is already below that low, but the 00:00 hour has not closed yet, so an intraday break can’t be taken as an effective breakdown. The previous post stopped at the 21:00 structure; this incremental change comes from the downward shift of the last two completed hours, and the 4-hour K line from 20:00–00:00 closing at 0.06209, far below the current cycle high at 0.07179.
Open interest (OI) declined from the sample peak at around 400.75 million SAND at 21:00 to 375.83 million at 23:00, a drop of about 6.2%. Since OI doesn’t distinguish between longs and shorts, it can’t independently tell the closing direction. The 00:00 settlement funding rate is -0.87309%—this is just the funding reading for a single settlement. A negative funding rate means that at settlement, the flow pays in the direction of longs, so you can’t use it to judge the subsequent price direction, nor can it prove that shorts have been squeezed out. Searches of the project blog and Binance announcements didn’t find any new information that could explain this round of SAND volatility, so I don’t attribute the move to news.
Next, I will only watch two already-observed boundaries: whether the complete 00:00 hour can hold above 0.06172; and if a rebound occurs, whether it can get back above the vicinity of 0.06459. If it continues to break down, we still need to wait for the hour close and confirmation from the trade/volume structure. If it recovers, we also need to see whether it can be maintained—not just whether it’s pierced once. The above is an observation of the perpetual market, not a trading signal. The charts include only the nine completed hourly K lines from 15:00–23:00, excluding the incomplete 00:00 K line.