

黑猫SabTheTrader
476 Posts

黑猫SabTheTrader
Report
Block User
👩💻4 Years NQ & Crypto Female Trader | 不管白猫黑猫,赚到钱的就是好猫 | X: SabTheTrader | Price action has the final say | 币安现货合约8折邀请码: SAB111
High-Frequency Trader
6.6 Years
180 Following
11.9K+ Followers
2.4K+ Liked
Posts
All
Quotes
Videos
Live
PINNED
🐱 Live time of Sab the Black Cat 🧡
I’ve recently started streaming on the Binance Square. Going forward, unless something special comes up, I’ll be streaming at:
🗓️ Monday to Friday
🕘 21:00–23:00 (evening)
The stream mainly covers what I normally do every day:
📈 Watching the Nasdaq 100 (NQ) spot market
📝 Pre-market plans, key levels, and waiting for setups
🎯 Entry/exit ideas and Price Action
If the NQ session ends early, we’ll also take a look at BTC, ETH, and the more active cryptocurrencies that evening.
My livestream might be a bit different from the lively chatrooms (welcome to the introvert’s livestream, haha).
Most of the time, I’ll just play some light music while I normally monitor the market. If there’s something worth talking about, I’ll share it. If there isn’t a suitable setup, we’ll wait together—I won’t force trades just for the sake of streaming (●'◡'●) (Trading is actually something that requires a lot of patience and emotional control.)
The stream is mainly in Chinese—English is also welcome.
If I ever have to cancel a stream last minute, or if the timing changes, I’ll let everyone know in advance on the Square.
Monday to Friday, at 9 PM.
If you want to see how I trade in my everyday life, come to the livestream.🐱
🐱 Live time of Sab the Black Cat 🧡
I’ve recently started streaming on the Binance Square. Going forward, unless something special comes up, I’ll be streaming at:
🗓️ Monday to Friday
🕘 21:00–23:00 (evening)
The stream mainly covers what I normally do every day:
📈 Watching the Nasdaq 100 (NQ) spot market
📝 Pre-market plans, key levels, and waiting for setups
🎯 Entry/exit ideas and Price Action
If the NQ session ends early, we’ll also take a look at BTC, ETH, and the more active cryptocurrencies that evening.
My livestream might be a bit different from the lively chatrooms (welcome to the introvert’s livestream, haha).
Most of the time, I’ll just play some light music while I normally monitor the market. If there’s something worth talking about, I’ll share it. If there isn’t a suitable setup, we’ll wait together—I won’t force trades just for the sake of streaming (●'◡'●) (Trading is actually something that requires a lot of patience and emotional control.)
The stream is mainly in Chinese—English is also welcome.
If I ever have to cancel a stream last minute, or if the timing changes, I’ll let everyone know in advance on the Square.
Monday to Friday, at 9 PM.
If you want to see how I trade in my everyday life, come to the livestream.🐱
I’ve recently started streaming on the Binance Square. Going forward, unless something special comes up, I’ll be streaming at:
🗓️ Monday to Friday
🕘 21:00–23:00 (evening)
The stream mainly covers what I normally do every day:
📈 Watching the Nasdaq 100 (NQ) spot market
📝 Pre-market plans, key levels, and waiting for setups
🎯 Entry/exit ideas and Price Action
If the NQ session ends early, we’ll also take a look at BTC, ETH, and the more active cryptocurrencies that evening.
My livestream might be a bit different from the lively chatrooms (welcome to the introvert’s livestream, haha).
Most of the time, I’ll just play some light music while I normally monitor the market. If there’s something worth talking about, I’ll share it. If there isn’t a suitable setup, we’ll wait together—I won’t force trades just for the sake of streaming (●'◡'●) (Trading is actually something that requires a lot of patience and emotional control.)
The stream is mainly in Chinese—English is also welcome.
If I ever have to cancel a stream last minute, or if the timing changes, I’ll let everyone know in advance on the Square.
Monday to Friday, at 9 PM.
If you want to see how I trade in my everyday life, come to the livestream.🐱

2.3k
17
120
2.3k
6666
6666

Leo - F0
·
--
Bullish🧧🧧🔥GOOD MORNING FROM DUBAİ, FAMİLY.🔥🧧🧧
I told you to buy $NEAR 💙 when it was at $1.5
As I told you before, $NEAR 💙 will be $20.💎
BTTC🔥🔥🧧🧧 $BTC
#1688家族family 💚 @周周1688 #DriftHackVictimsBeginClaims #EthereumValidatorExitQueueJumps392% #BitcoinRejectedAt$87K #xrp
I told you to buy $NEAR 💙 when it was at $1.5
As I told you before, $NEAR 💙 will be $20.💎
BTTC🔥🔥🧧🧧 $BTC
#1688家族family 💚 @周周1688 #DriftHackVictimsBeginClaims #EthereumValidatorExitQueueJumps392% #BitcoinRejectedAt$87K #xrp

337
Come on over!
Come on over!

@慢就是快Mike
is speaking[LIVE] 🎙️ BNB breaks through 800—are we in a bull run, guys!!!
4.9k listens
312
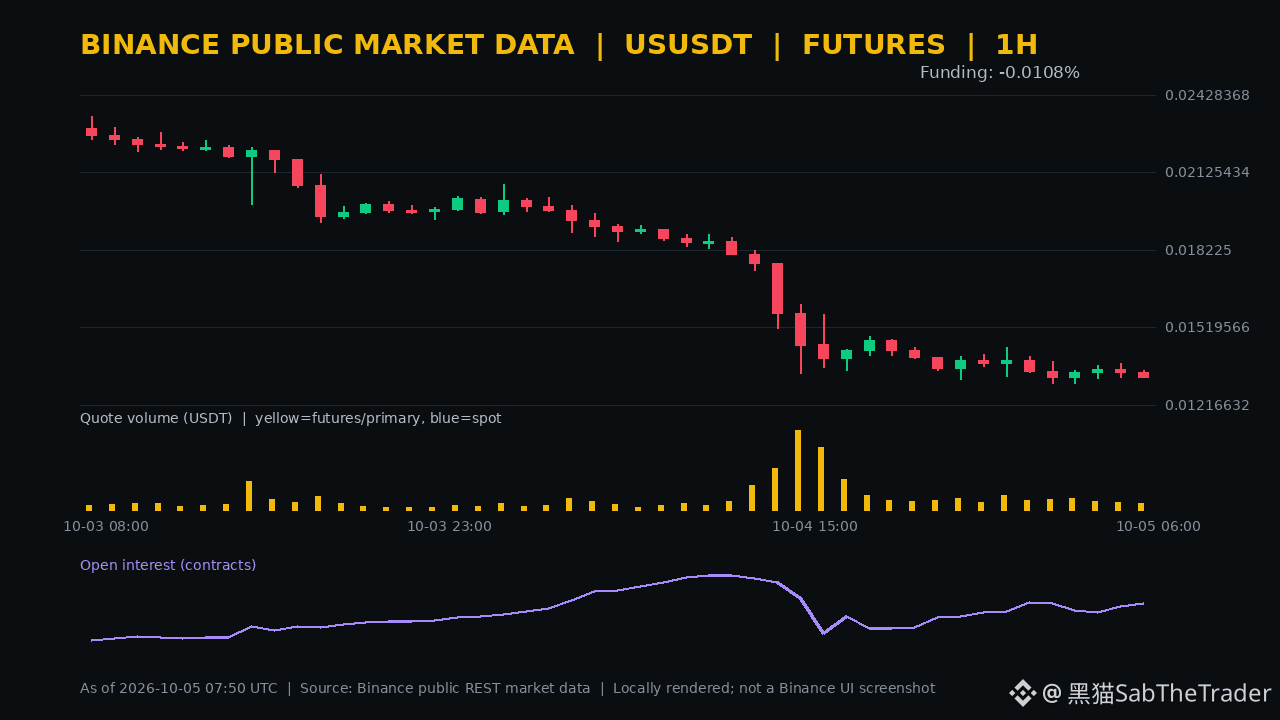
After falling more than 30% in 24 hours, the market has yet to show clear signs of position liquidation. Public Binance data at 15:50 (UTC+8) showed $US perpetual trading at 0.012811, down 32.32% over 24 hours, with about 97.95 million USDT in trading volume; the current, still-open hourly candle is down a further 3.22% from the previous hour’s close.
The previous full hour fell 1.36%, with about 1.5 million USDT in trading volume, down 16.92% from the hour before. Prices were nearly flat over the last four full hours, while trading volume fell 16.51% compared with the preceding four hours. Short-term volume has cooled, but contract-count OI still rose 0.47% over the past hour and 2.38% over the 30-point window, indicating that the number of contracts has not contracted in step with the price decline. This does not reveal the direction of newly opened positions, but it does mean leverage-driven disagreement remains.
The funding indicator is at -0.0108%, while the most recent actual settlement was -0.0031%—negative, but not yet extreme. After a sharp decline, chasing shorts means guarding against both further downside and a rapid rebound in a low-liquidity environment.
In the short term, watch 0.013231–0.013510, the range of the previous full hour. If a subsequent full hourly candle fails to close back above 0.013231 while OI continues to rise, bearish pressure will remain dominant. If the price reclaims 0.013510 and OI falls, that would look more like crowded positions unwinding, making it significantly less attractive to chase shorts.
After falling more than 30% in 24 hours, the market has yet to show clear signs of position liquidation. Public Binance data at 15:50 (UTC+8) showed $US perpetual trading at 0.012811, down 32.32% over 24 hours, with about 97.95 million USDT in trading volume; the current, still-open hourly candle is down a further 3.22% from the previous hour’s close.
The previous full hour fell 1.36%, with about 1.5 million USDT in trading volume, down 16.92% from the hour before. Prices were nearly flat over the last four full hours, while trading volume fell 16.51% compared with the preceding four hours. Short-term volume has cooled, but contract-count OI still rose 0.47% over the past hour and 2.38% over the 30-point window, indicating that the number of contracts has not contracted in step with the price decline. This does not reveal the direction of newly opened positions, but it does mean leverage-driven disagreement remains.
The funding indicator is at -0.0108%, while the most recent actual settlement was -0.0031%—negative, but not yet extreme. After a sharp decline, chasing shorts means guarding against both further downside and a rapid rebound in a low-liquidity environment.
In the short term, watch 0.013231–0.013510, the range of the previous full hour. If a subsequent full hourly candle fails to close back above 0.013231 while OI continues to rise, bearish pressure will remain dominant. If the price reclaims 0.013510 and OI falls, that would look more like crowded positions unwinding, making it significantly less attractive to chase shorts.
The previous full hour fell 1.36%, with about 1.5 million USDT in trading volume, down 16.92% from the hour before. Prices were nearly flat over the last four full hours, while trading volume fell 16.51% compared with the preceding four hours. Short-term volume has cooled, but contract-count OI still rose 0.47% over the past hour and 2.38% over the 30-point window, indicating that the number of contracts has not contracted in step with the price decline. This does not reveal the direction of newly opened positions, but it does mean leverage-driven disagreement remains.
The funding indicator is at -0.0108%, while the most recent actual settlement was -0.0031%—negative, but not yet extreme. After a sharp decline, chasing shorts means guarding against both further downside and a rapid rebound in a low-liquidity environment.
In the short term, watch 0.013231–0.013510, the range of the previous full hour. If a subsequent full hourly candle fails to close back above 0.013231 while OI continues to rise, bearish pressure will remain dominant. If the price reclaims 0.013510 and OI falls, that would look more like crowded positions unwinding, making it significantly less attractive to chase shorts.
1
811

CJ_GraceWang1688
·
--
🎁🎁🎁
$BTC
#比特币冲击8.7万美元遇阻回落
Big cookie first goes back to 82,000 or should we push for 90,000 first?
$BTC
#比特币冲击8.7万美元遇阻回落
Big cookie first goes back to 82,000 or should we push for 90,000 first?
2
537
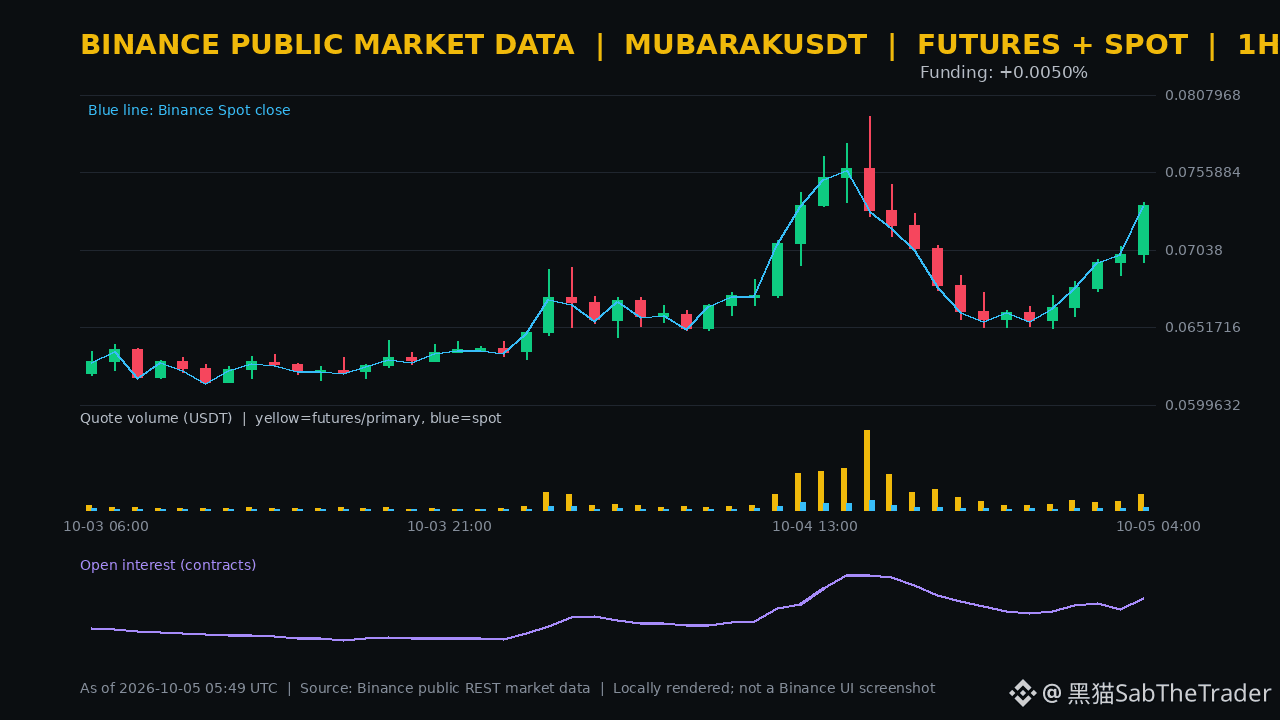
Prices, trading activity, and open positions are all rising in this round at the same time—having more information value than a standalone price increase. According to Binance’s public data at 13:48 (UTC+8), $MUBARAK spot is quoted at 0.07745, up 17.08% over the past 24 hours; the perpetual contract is at 0.07757, up 17.30%, with approximately 148 million USDT in trading volume over the past 24 hours.
In the previous complete hour, spot and perps rose by 4.64% and 4.67%, respectively. Perp trading volume was about 5.34 million USDT, up 83.21% month-over-month; spot trading volume also increased 48.98% month-over-month. Over the most recent four complete hours, perps rose 10.24%, and trading volume increased 69.00% compared with the prior four hours. OI (open interest) increased by 1.62% over one hour, and the 30-point window increased by 6.01%. With quantity, price, and positions moving together, the underlying structure remains intact.
Funding indications and the most recent actual settlement were both +0.0050%, not following the price surge into crowded positive territory. However, OI only indicates that the number of contracts increased; it cannot determine the direction of new positioning. After a quick surge, any weakening in follow-through could still trigger deleveraging.
For the short term, first look at the prior complete hour’s range of 0.06955–0.07357. In the subsequent complete hour, only if it holds above 0.07357 and trading volume and OI continue to expand can the breakout be considered confirmed. If it falls back below 0.06955 and OI declines as well, treat it as a position “tide retreat” after a high, and do not chase the price.
Prices, trading activity, and open positions are all rising in this round at the same time—having more information value than a standalone price increase. According to Binance’s public data at 13:48 (UTC+8), $MUBARAK spot is quoted at 0.07745, up 17.08% over the past 24 hours; the perpetual contract is at 0.07757, up 17.30%, with approximately 148 million USDT in trading volume over the past 24 hours.
In the previous complete hour, spot and perps rose by 4.64% and 4.67%, respectively. Perp trading volume was about 5.34 million USDT, up 83.21% month-over-month; spot trading volume also increased 48.98% month-over-month. Over the most recent four complete hours, perps rose 10.24%, and trading volume increased 69.00% compared with the prior four hours. OI (open interest) increased by 1.62% over one hour, and the 30-point window increased by 6.01%. With quantity, price, and positions moving together, the underlying structure remains intact.
Funding indications and the most recent actual settlement were both +0.0050%, not following the price surge into crowded positive territory. However, OI only indicates that the number of contracts increased; it cannot determine the direction of new positioning. After a quick surge, any weakening in follow-through could still trigger deleveraging.
For the short term, first look at the prior complete hour’s range of 0.06955–0.07357. In the subsequent complete hour, only if it holds above 0.07357 and trading volume and OI continue to expand can the breakout be considered confirmed. If it falls back below 0.06955 and OI declines as well, treat it as a position “tide retreat” after a high, and do not chase the price.
In the previous complete hour, spot and perps rose by 4.64% and 4.67%, respectively. Perp trading volume was about 5.34 million USDT, up 83.21% month-over-month; spot trading volume also increased 48.98% month-over-month. Over the most recent four complete hours, perps rose 10.24%, and trading volume increased 69.00% compared with the prior four hours. OI (open interest) increased by 1.62% over one hour, and the 30-point window increased by 6.01%. With quantity, price, and positions moving together, the underlying structure remains intact.
Funding indications and the most recent actual settlement were both +0.0050%, not following the price surge into crowded positive territory. However, OI only indicates that the number of contracts increased; it cannot determine the direction of new positioning. After a quick surge, any weakening in follow-through could still trigger deleveraging.
For the short term, first look at the prior complete hour’s range of 0.06955–0.07357. In the subsequent complete hour, only if it holds above 0.07357 and trading volume and OI continue to expand can the breakout be considered confirmed. If it falls back below 0.06955 and OI declines as well, treat it as a position “tide retreat” after a high, and do not chase the price.
1
434
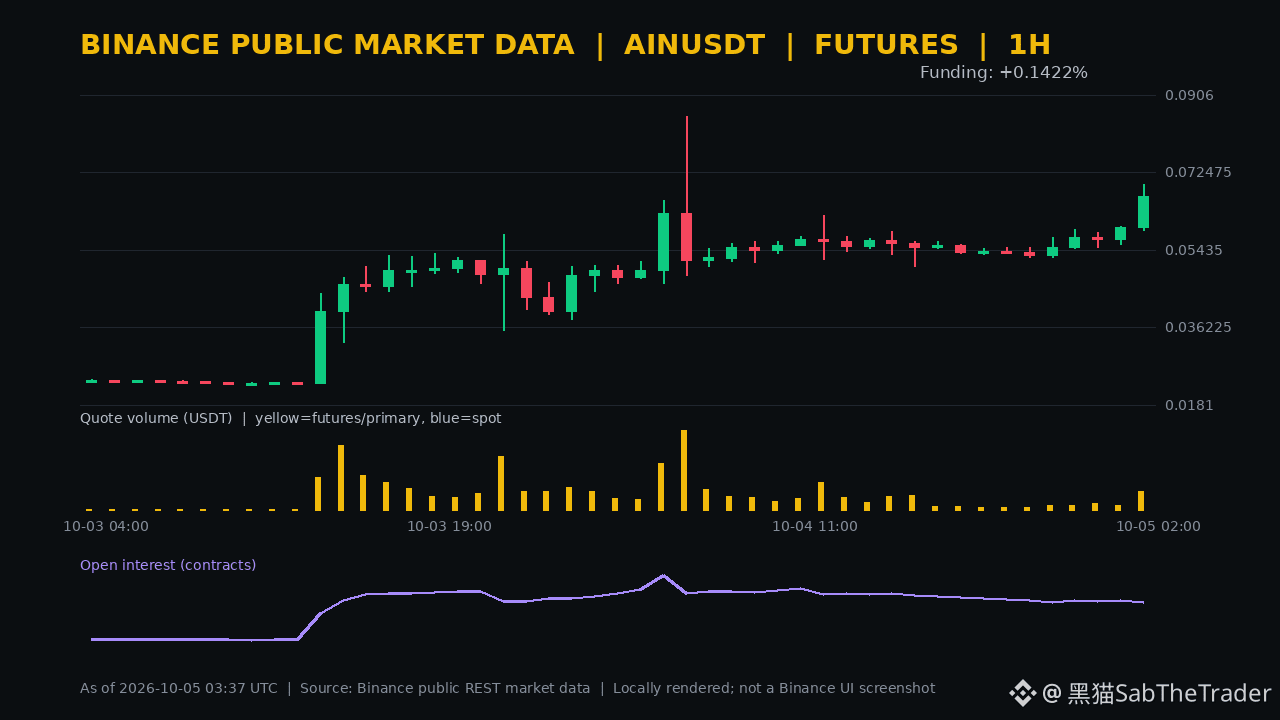
Prices are accelerating, but positions haven’t caught up. According to Binance perpetual public data at 11:36 (UTC+8), $AIN is at 0.07110, up 46.21% over 24 hours. The range high/low is 0.08560/0.04640, with trading volume of about 421 million USDT. For this asset, this time it is still only confirmed as available to trade on perpetuals.
In the previous full hour, it rose 12.33%, and trading volume increased by 278.03% quarter-on-quarter; over the most recent four complete hours, it has accumulated a gain of 21.89%, with trading volume up 218.41% compared with the prior four hours. The current (not yet closed) hour is also 6.27% higher than the closing price of the previous hour. Price and volume are accelerating further, but intraday changes cannot be treated as a closing confirmation.
The divergence comes from positioning: quantity OI fell 2.34% in the last hour and dropped 8.65% over the 30-point window. The Funding indicator is +0.1422%, while the most recent actual settlement is +0.1638%. As price is pushed up while OI contracts, it may involve deleveraging or short covering. On its own, OI cannot confirm which side is backing off; positive Funding also means long positions still have a high holding cost.
Only if a full hour holds above 0.06966 without a noticeable drop in trading activity can there be a basis for further testing of 0.08560. Once it falls back below 0.05891 and OI continues contracting, I will prioritize treating it as deleveraging after the spike. In a high-volatility phase, don’t chase the intraday surge by increasing leverage.
Prices are accelerating, but positions haven’t caught up. According to Binance perpetual public data at 11:36 (UTC+8), $AIN is at 0.07110, up 46.21% over 24 hours. The range high/low is 0.08560/0.04640, with trading volume of about 421 million USDT. For this asset, this time it is still only confirmed as available to trade on perpetuals.
In the previous full hour, it rose 12.33%, and trading volume increased by 278.03% quarter-on-quarter; over the most recent four complete hours, it has accumulated a gain of 21.89%, with trading volume up 218.41% compared with the prior four hours. The current (not yet closed) hour is also 6.27% higher than the closing price of the previous hour. Price and volume are accelerating further, but intraday changes cannot be treated as a closing confirmation.
The divergence comes from positioning: quantity OI fell 2.34% in the last hour and dropped 8.65% over the 30-point window. The Funding indicator is +0.1422%, while the most recent actual settlement is +0.1638%. As price is pushed up while OI contracts, it may involve deleveraging or short covering. On its own, OI cannot confirm which side is backing off; positive Funding also means long positions still have a high holding cost.
Only if a full hour holds above 0.06966 without a noticeable drop in trading activity can there be a basis for further testing of 0.08560. Once it falls back below 0.05891 and OI continues contracting, I will prioritize treating it as deleveraging after the spike. In a high-volatility phase, don’t chase the intraday surge by increasing leverage.
In the previous full hour, it rose 12.33%, and trading volume increased by 278.03% quarter-on-quarter; over the most recent four complete hours, it has accumulated a gain of 21.89%, with trading volume up 218.41% compared with the prior four hours. The current (not yet closed) hour is also 6.27% higher than the closing price of the previous hour. Price and volume are accelerating further, but intraday changes cannot be treated as a closing confirmation.
The divergence comes from positioning: quantity OI fell 2.34% in the last hour and dropped 8.65% over the 30-point window. The Funding indicator is +0.1422%, while the most recent actual settlement is +0.1638%. As price is pushed up while OI contracts, it may involve deleveraging or short covering. On its own, OI cannot confirm which side is backing off; positive Funding also means long positions still have a high holding cost.
Only if a full hour holds above 0.06966 without a noticeable drop in trading activity can there be a basis for further testing of 0.08560. Once it falls back below 0.05891 and OI continues contracting, I will prioritize treating it as deleveraging after the spike. In a high-volatility phase, don’t chase the intraday surge by increasing leverage.
358
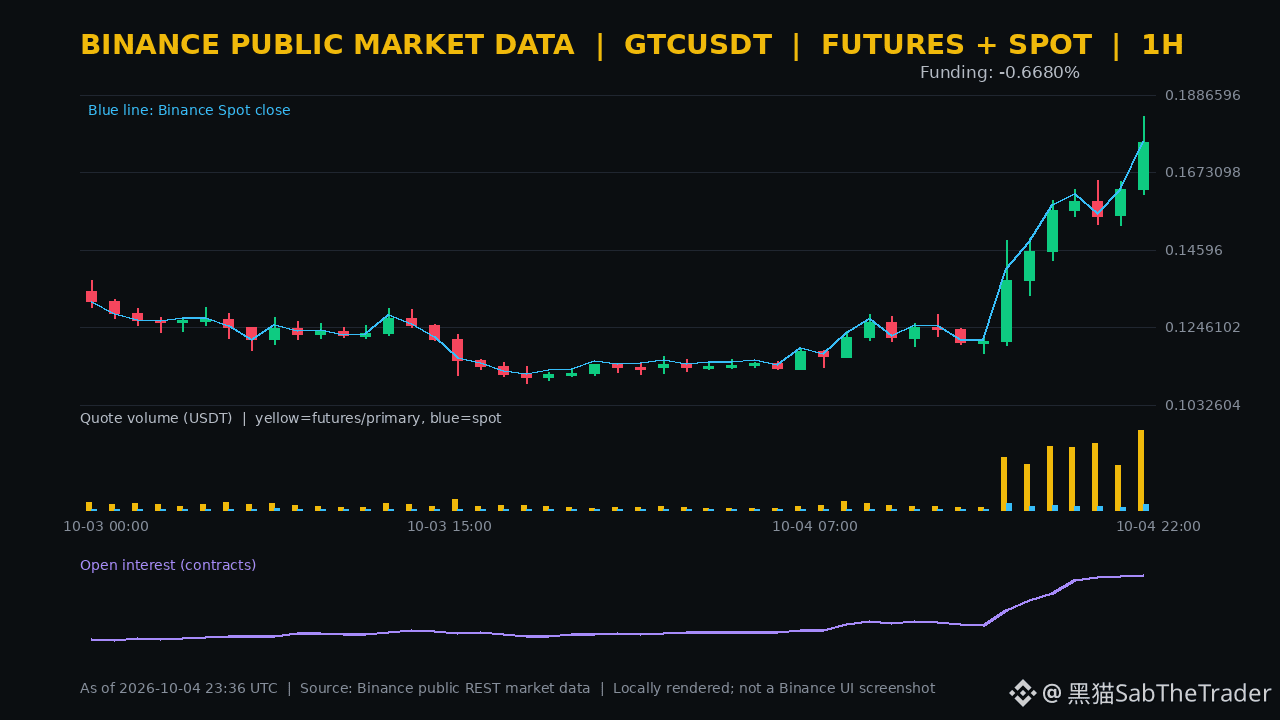
This round of the upswing wasn’t driven by price alone. Binance’s public data at 07:36 (UTC+8) shows that perpetual contracts are at 0.17611 for $GTC , up 55.29% over the past 24 hours; the spot price is 0.17580, up 53.59%. Both markets are moving in the same direction.
In the previous complete 1-hour period, perps rose 7.91% with trading volume up 80.93% quarter-over-quarter; spot rose 8.02% with trading volume up 98.39% in the same period. Over the most recent four complete hours, perps accumulated gains of 11.85%, with trading volume 53.21% higher than the prior four hours—near-term volume and price action are still expanding.
Positions and fees reveal sharper divergence: open interest (OI) increased by 0.60% over the last hour, and within a 48-point window it rose 53.41%. The Funding indicator is -0.6680%, while the most recent actual settlement is -0.4830%. When price, trading, and positions all move up together, shorts still pay elevated costs, suggesting the squeeze could continue. However, deeply negative Funding does not necessarily mean price must keep rising, and quantity-based OI cannot determine the direction of newly added positions.
The current unclosed hour is only about 0.32% higher than the previous hour’s close. If the full hour holds above 0.17550, and both成交量 and OI continue to expand, there would be a basis to retest 0.18277. If it breaks below 0.16120 and is accompanied by OI contraction, prioritize guarding against deleveraging at higher levels rather than simply treating the pullback as a follow-on opportunity.
This round of the upswing wasn’t driven by price alone. Binance’s public data at 07:36 (UTC+8) shows that perpetual contracts are at 0.17611 for $GTC , up 55.29% over the past 24 hours; the spot price is 0.17580, up 53.59%. Both markets are moving in the same direction.
In the previous complete 1-hour period, perps rose 7.91% with trading volume up 80.93% quarter-over-quarter; spot rose 8.02% with trading volume up 98.39% in the same period. Over the most recent four complete hours, perps accumulated gains of 11.85%, with trading volume 53.21% higher than the prior four hours—near-term volume and price action are still expanding.
Positions and fees reveal sharper divergence: open interest (OI) increased by 0.60% over the last hour, and within a 48-point window it rose 53.41%. The Funding indicator is -0.6680%, while the most recent actual settlement is -0.4830%. When price, trading, and positions all move up together, shorts still pay elevated costs, suggesting the squeeze could continue. However, deeply negative Funding does not necessarily mean price must keep rising, and quantity-based OI cannot determine the direction of newly added positions.
The current unclosed hour is only about 0.32% higher than the previous hour’s close. If the full hour holds above 0.17550, and both成交量 and OI continue to expand, there would be a basis to retest 0.18277. If it breaks below 0.16120 and is accompanied by OI contraction, prioritize guarding against deleveraging at higher levels rather than simply treating the pullback as a follow-on opportunity.
In the previous complete 1-hour period, perps rose 7.91% with trading volume up 80.93% quarter-over-quarter; spot rose 8.02% with trading volume up 98.39% in the same period. Over the most recent four complete hours, perps accumulated gains of 11.85%, with trading volume 53.21% higher than the prior four hours—near-term volume and price action are still expanding.
Positions and fees reveal sharper divergence: open interest (OI) increased by 0.60% over the last hour, and within a 48-point window it rose 53.41%. The Funding indicator is -0.6680%, while the most recent actual settlement is -0.4830%. When price, trading, and positions all move up together, shorts still pay elevated costs, suggesting the squeeze could continue. However, deeply negative Funding does not necessarily mean price must keep rising, and quantity-based OI cannot determine the direction of newly added positions.
The current unclosed hour is only about 0.32% higher than the previous hour’s close. If the full hour holds above 0.17550, and both成交量 and OI continue to expand, there would be a basis to retest 0.18277. If it breaks below 0.16120 and is accompanied by OI contraction, prioritize guarding against deleveraging at higher levels rather than simply treating the pullback as a follow-on opportunity.
1
993
Greed Index at 68: $BTC Should You Chase or Run? I Looked at Four Years of Data 👀
When people see “the market is greedy,” some want to chase the rally, while others get ready to short. But the market can behave very differently after the same reading of 68.
💡 I checked the dates from October 4, 2022, to October 3, 2026, when the Alternative.me reading was exactly 68. There were 19 of them. Using the BTC daily closing price on each date as the baseline:
▸ 7 days later: 10 were up and 9 were down;
▸ 30 days later: also 10 were up and 9 were down.
Note that these 19 dates include consecutive or near-consecutive observations, and the follow-up periods overlap. They shouldn’t be treated as 19 independent trades, and 10/19 certainly shouldn’t be presented as a long-trade win rate. The sample is small, and fees aren’t included.
A few examples make the differences clearer:
1️⃣ April 14, 2023: Index at 68.
BTC closed at around $30,500 that day, then fell about 10.5% over the next 7 days and about 11.7% over the next 30 days. Sentiment can be hot while prices still pull back.
2️⃣ November 7, 2023: Index also at 68.
BTC closed at around $35,400, then rose about 0.3% over the next 7 days and about 22.2% over the next 30 days. If you assume greed means a top, you might get out too early.
3️⃣ July 26, 2024: Still at 68.
BTC closed at around $67,900, then fell about 9.6% over the next 7 days and about 5.3% over the next 30 days. The same reading didn’t reproduce the rally from the previous cycle.
4️⃣ June 17, 2025: Index at 68.
BTC closed at around $104,600, then rose about 1.4% over the next 7 days and about 14.0% over the next 30 days. Greed can accompany a continuing trend, too.
These comparisons remind me that one number can’t capture the trend, buying pressure, and market conditions at the time.
And Alternative.me’s calculation already includes price volatility, momentum, and trading volume. A rising market can push the index higher, so using the index to prove that “prices will keep rising” can easily become circular reasoning.
I’d look one step further: Is this reading of 68 rising gradually from fear, or falling from a higher level of greed? Is the price holding after a breakout, or repeatedly spiking and pulling back?
I’ll keep an eye on the market tonight, Sunday, too. If price holds on a retest after breaking out, I’ll keep watching for the uptrend to continue; if it spikes and then falls back into the range, I’ll be less inclined to chase. Especially with futures, don’t use a sentiment reading as a reason to add to your position. 🙈
Price action has the final say.
* NFA, DYOR
#比特币冲击8.7万美元遇阻回落
Greed Index at 68: $BTC Should You Chase or Run? I Looked at Four Years of Data 👀
When people see “the market is greedy,” some want to chase the rally, while others get ready to short. But the market can behave very differently after the same reading of 68.
💡 I checked the dates from October 4, 2022, to October 3, 2026, when the Alternative.me reading was exactly 68. There were 19 of them. Using the BTC daily closing price on each date as the baseline:
▸ 7 days later: 10 were up and 9 were down;
▸ 30 days later: also 10 were up and 9 were down.
Note that these 19 dates include consecutive or near-consecutive observations, and the follow-up periods overlap. They shouldn’t be treated as 19 independent trades, and 10/19 certainly shouldn’t be presented as a long-trade win rate. The sample is small, and fees aren’t included.
A few examples make the differences clearer:
1️⃣ April 14, 2023: Index at 68.
BTC closed at around $30,500 that day, then fell about 10.5% over the next 7 days and about 11.7% over the next 30 days. Sentiment can be hot while prices still pull back.
2️⃣ November 7, 2023: Index also at 68.
BTC closed at around $35,400, then rose about 0.3% over the next 7 days and about 22.2% over the next 30 days. If you assume greed means a top, you might get out too early.
3️⃣ July 26, 2024: Still at 68.
BTC closed at around $67,900, then fell about 9.6% over the next 7 days and about 5.3% over the next 30 days. The same reading didn’t reproduce the rally from the previous cycle.
4️⃣ June 17, 2025: Index at 68.
BTC closed at around $104,600, then rose about 1.4% over the next 7 days and about 14.0% over the next 30 days. Greed can accompany a continuing trend, too.
These comparisons remind me that one number can’t capture the trend, buying pressure, and market conditions at the time.
And Alternative.me’s calculation already includes price volatility, momentum, and trading volume. A rising market can push the index higher, so using the index to prove that “prices will keep rising” can easily become circular reasoning.
I’d look one step further: Is this reading of 68 rising gradually from fear, or falling from a higher level of greed? Is the price holding after a breakout, or repeatedly spiking and pulling back?
I’ll keep an eye on the market tonight, Sunday, too. If price holds on a retest after breaking out, I’ll keep watching for the uptrend to continue; if it spikes and then falls back into the range, I’ll be less inclined to chase. Especially with futures, don’t use a sentiment reading as a reason to add to your position. 🙈
Price action has the final say.
* NFA, DYOR
#比特币冲击8.7万美元遇阻回落
When people see “the market is greedy,” some want to chase the rally, while others get ready to short. But the market can behave very differently after the same reading of 68.
💡 I checked the dates from October 4, 2022, to October 3, 2026, when the Alternative.me reading was exactly 68. There were 19 of them. Using the BTC daily closing price on each date as the baseline:
▸ 7 days later: 10 were up and 9 were down;
▸ 30 days later: also 10 were up and 9 were down.
Note that these 19 dates include consecutive or near-consecutive observations, and the follow-up periods overlap. They shouldn’t be treated as 19 independent trades, and 10/19 certainly shouldn’t be presented as a long-trade win rate. The sample is small, and fees aren’t included.
A few examples make the differences clearer:
1️⃣ April 14, 2023: Index at 68.
BTC closed at around $30,500 that day, then fell about 10.5% over the next 7 days and about 11.7% over the next 30 days. Sentiment can be hot while prices still pull back.
2️⃣ November 7, 2023: Index also at 68.
BTC closed at around $35,400, then rose about 0.3% over the next 7 days and about 22.2% over the next 30 days. If you assume greed means a top, you might get out too early.
3️⃣ July 26, 2024: Still at 68.
BTC closed at around $67,900, then fell about 9.6% over the next 7 days and about 5.3% over the next 30 days. The same reading didn’t reproduce the rally from the previous cycle.
4️⃣ June 17, 2025: Index at 68.
BTC closed at around $104,600, then rose about 1.4% over the next 7 days and about 14.0% over the next 30 days. Greed can accompany a continuing trend, too.
These comparisons remind me that one number can’t capture the trend, buying pressure, and market conditions at the time.
And Alternative.me’s calculation already includes price volatility, momentum, and trading volume. A rising market can push the index higher, so using the index to prove that “prices will keep rising” can easily become circular reasoning.
I’d look one step further: Is this reading of 68 rising gradually from fear, or falling from a higher level of greed? Is the price holding after a breakout, or repeatedly spiking and pulling back?
I’ll keep an eye on the market tonight, Sunday, too. If price holds on a retest after breaking out, I’ll keep watching for the uptrend to continue; if it spikes and then falls back into the range, I’ll be less inclined to chase. Especially with futures, don’t use a sentiment reading as a reason to add to your position. 🙈
Price action has the final say.
* NFA, DYOR
#比特币冲击8.7万美元遇阻回落

1.3k
27
89
1.3k
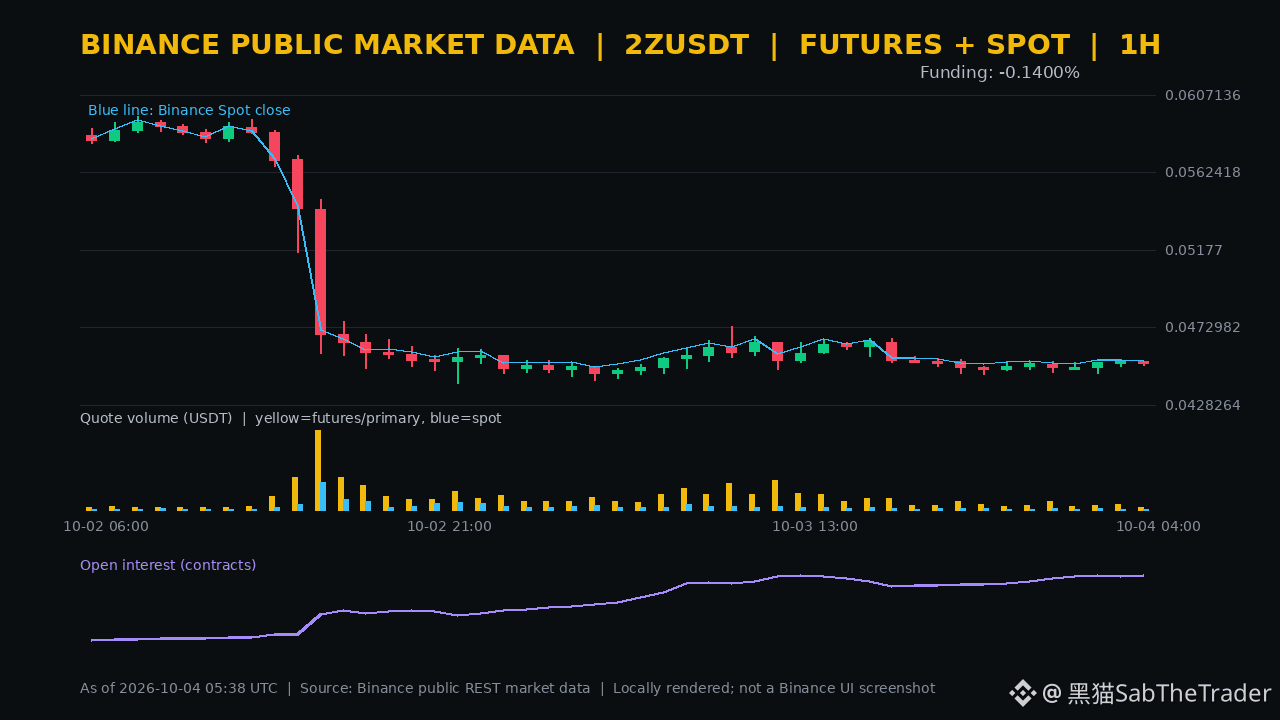
Position expansion is faster than price movement. Public Binance data at 13:38 (UTC+8) shows the $2Z perpetual at 0.04561, up 1.85% over the past 24 hours; the spot price is 0.04582, up 1.62%. The current unclosed hour is 0.86% higher than the previous hour’s close.
Over the last complete 1 hour, the perpetual price fell 0.24% and trading volume decreased 46.88% quarter-over-quarter; meanwhile, spot in the same period fell 0.20% and trading volume also fell 40.69%. In the most recent four complete hours, prices were still up 0.53%, but trading volume was 25.48% lower than in the preceding four hours, suggesting the rebound has not yet been confirmed by sustained momentum.
On the other hand, the quantity OI (open interest) increased 0.31% over the last hour, and within the 48-point window it rose 80.06%. Funding indicators were -0.1400%, while the most recent actual settlement was -0.1718%. When price is consolidating with a bullish bias, positions keep building up and shorts pay the funding. This can both become “squeeze fuel” and amplify moves in the opposite direction. Quantity OI by itself cannot determine the direction of newly added positions.
Only if the full hour holds above 0.04534 and both成交量 and OI expand in sync would the short-term setup have conditions to further test 0.04736. If it breaks below 0.04508 and OI declines alongside it, this move looks more like crowded positioning unwinding rather than a valid breakout.
Position expansion is faster than price movement. Public Binance data at 13:38 (UTC+8) shows the $2Z perpetual at 0.04561, up 1.85% over the past 24 hours; the spot price is 0.04582, up 1.62%. The current unclosed hour is 0.86% higher than the previous hour’s close.
Over the last complete 1 hour, the perpetual price fell 0.24% and trading volume decreased 46.88% quarter-over-quarter; meanwhile, spot in the same period fell 0.20% and trading volume also fell 40.69%. In the most recent four complete hours, prices were still up 0.53%, but trading volume was 25.48% lower than in the preceding four hours, suggesting the rebound has not yet been confirmed by sustained momentum.
On the other hand, the quantity OI (open interest) increased 0.31% over the last hour, and within the 48-point window it rose 80.06%. Funding indicators were -0.1400%, while the most recent actual settlement was -0.1718%. When price is consolidating with a bullish bias, positions keep building up and shorts pay the funding. This can both become “squeeze fuel” and amplify moves in the opposite direction. Quantity OI by itself cannot determine the direction of newly added positions.
Only if the full hour holds above 0.04534 and both成交量 and OI expand in sync would the short-term setup have conditions to further test 0.04736. If it breaks below 0.04508 and OI declines alongside it, this move looks more like crowded positioning unwinding rather than a valid breakout.
Over the last complete 1 hour, the perpetual price fell 0.24% and trading volume decreased 46.88% quarter-over-quarter; meanwhile, spot in the same period fell 0.20% and trading volume also fell 40.69%. In the most recent four complete hours, prices were still up 0.53%, but trading volume was 25.48% lower than in the preceding four hours, suggesting the rebound has not yet been confirmed by sustained momentum.
On the other hand, the quantity OI (open interest) increased 0.31% over the last hour, and within the 48-point window it rose 80.06%. Funding indicators were -0.1400%, while the most recent actual settlement was -0.1718%. When price is consolidating with a bullish bias, positions keep building up and shorts pay the funding. This can both become “squeeze fuel” and amplify moves in the opposite direction. Quantity OI by itself cannot determine the direction of newly added positions.
Only if the full hour holds above 0.04534 and both成交量 and OI expand in sync would the short-term setup have conditions to further test 0.04736. If it breaks below 0.04508 and OI declines alongside it, this move looks more like crowded positioning unwinding rather than a valid breakout.
406
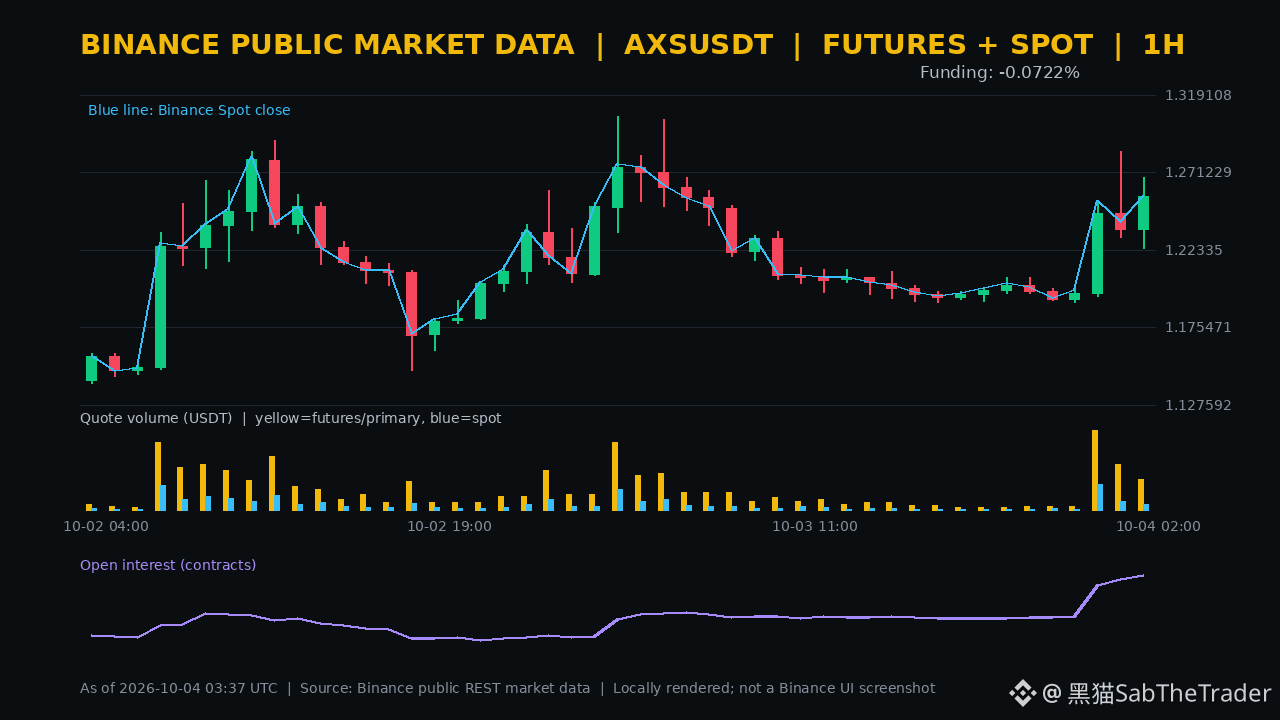
Short-term capital is re-pricing this move. According to Binance public data at 11:38 (UTC+8), the $AXS perpetual is at 1.3128, with a 24-hour gain of only 0.89%, but in the last 4 completed hours it has already risen 5.32%. The currently open (not yet closed) hour is also 4.51% higher than the previous hour’s closing price.
In the previous completed 1-hour period, the price rose 1.61%. Perpetual trading volume was about 2.64 million USDT, down 33.96% from the prior hour, but over the last 4 completed hours the volume is still about 1144% higher than the earlier 4 hours. Spot in the same completed hour rose 1.37%. Both markets moved in the same direction, but after the burst, volume has started to cool off.
OI over the past hour increased by 1.55%, and the 48-point window increased by 22.66%. The Funding indicator is -0.0722%, and the most recent actual settlement is -0.0134%. When both price and positions rise together, shorts are still paying; this may continue to drive squeezes, and it also means volatility and the risk of counter-liquidations are building.
I’ll wait for the completed hour to confirm. If price holds 1.2683, and both成交 and OI expand again, then strength would have a base to continue testing 1.3270. If it breaks below 1.2244 and is accompanied by OI contraction, it looks more like deleveraging at high levels rather than a healthy pullback.
Short-term capital is re-pricing this move. According to Binance public data at 11:38 (UTC+8), the $AXS perpetual is at 1.3128, with a 24-hour gain of only 0.89%, but in the last 4 completed hours it has already risen 5.32%. The currently open (not yet closed) hour is also 4.51% higher than the previous hour’s closing price.
In the previous completed 1-hour period, the price rose 1.61%. Perpetual trading volume was about 2.64 million USDT, down 33.96% from the prior hour, but over the last 4 completed hours the volume is still about 1144% higher than the earlier 4 hours. Spot in the same completed hour rose 1.37%. Both markets moved in the same direction, but after the burst, volume has started to cool off.
OI over the past hour increased by 1.55%, and the 48-point window increased by 22.66%. The Funding indicator is -0.0722%, and the most recent actual settlement is -0.0134%. When both price and positions rise together, shorts are still paying; this may continue to drive squeezes, and it also means volatility and the risk of counter-liquidations are building.
I’ll wait for the completed hour to confirm. If price holds 1.2683, and both成交 and OI expand again, then strength would have a base to continue testing 1.3270. If it breaks below 1.2244 and is accompanied by OI contraction, it looks more like deleveraging at high levels rather than a healthy pullback.
In the previous completed 1-hour period, the price rose 1.61%. Perpetual trading volume was about 2.64 million USDT, down 33.96% from the prior hour, but over the last 4 completed hours the volume is still about 1144% higher than the earlier 4 hours. Spot in the same completed hour rose 1.37%. Both markets moved in the same direction, but after the burst, volume has started to cool off.
OI over the past hour increased by 1.55%, and the 48-point window increased by 22.66%. The Funding indicator is -0.0722%, and the most recent actual settlement is -0.0134%. When both price and positions rise together, shorts are still paying; this may continue to drive squeezes, and it also means volatility and the risk of counter-liquidations are building.
I’ll wait for the completed hour to confirm. If price holds 1.2683, and both成交 and OI expand again, then strength would have a base to continue testing 1.3270. If it breaks below 1.2244 and is accompanied by OI contraction, it looks more like deleveraging at high levels rather than a healthy pullback.
448
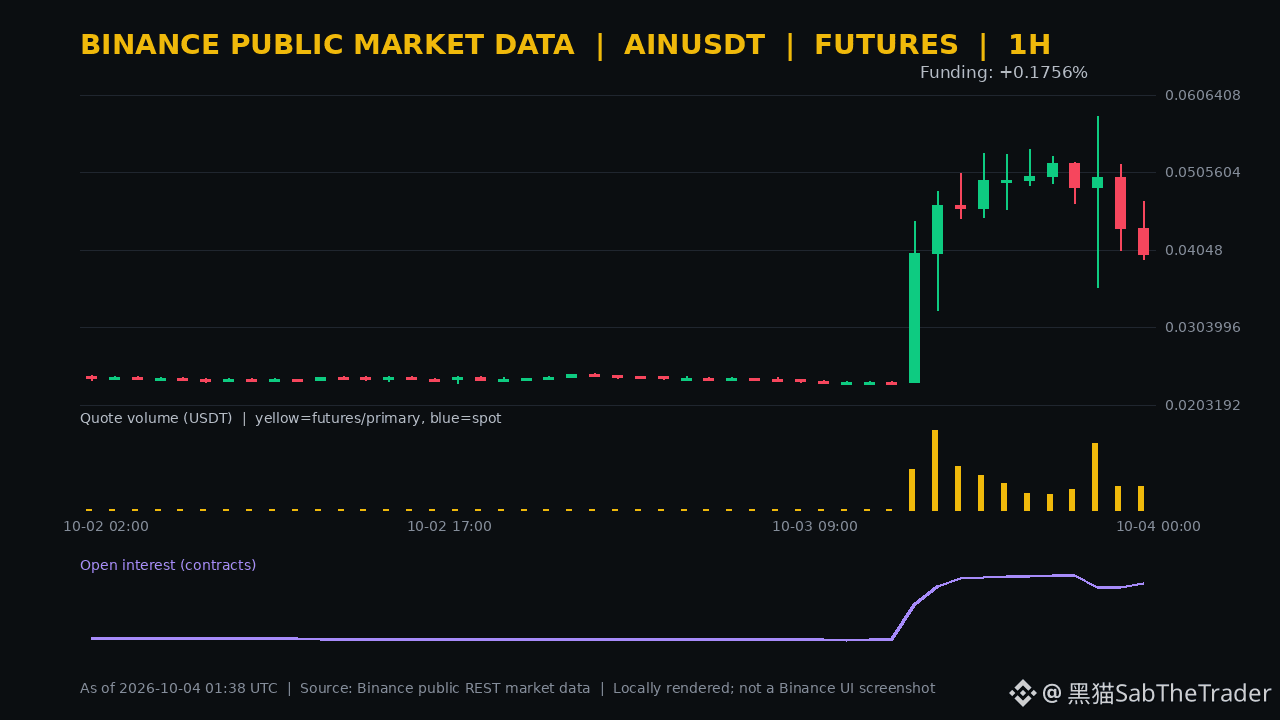
High-level turnover has pushed volatility to extremes. Binance perpetual data at 09:38 (UTC+8) shows $AIN at 0.04705: up 96.04% over the past 24 hours. The range high/low is 0.05786/0.02310, with trading volume of about 399 million USDT.
In the previous complete 1-hour period, the price fell 7.82%, and trading volume decreased 2.14% month-on-month; however, the current unfinished hour has bounced 17.75% from the previous hour’s close. Over the past nearly 4 hours, it is still down 22.88%, but trading volume is up 44.41% compared with the prior 4 hours—short-term activity shows a surge followed by intense, volatile contention.
Quantity OI has increased 2.30% in the last hour, and the 30-point window has increased 51.96%. The Funding indicator is +0.1756%, and the most recent realized settlement is +0.2149%. Positions continue to expand, and long holders’ average costs are relatively high. Since OI can’t determine the direction of new positions, positive Funding does not necessarily mean the price must drop.
I place more emphasis on confirmation within a full hour. If the close can hold above 0.04673, and OI and trading volume continue to expand, then the rebound has a basis to continue. If it breaks back below 0.03922 while OI contracts, high-level deleveraging may accelerate again. With the 24-hour gain nearing a doubling, when chasing price or trying to top in the face of the trend, leverage must be kept under control.
High-level turnover has pushed volatility to extremes. Binance perpetual data at 09:38 (UTC+8) shows $AIN at 0.04705: up 96.04% over the past 24 hours. The range high/low is 0.05786/0.02310, with trading volume of about 399 million USDT.
In the previous complete 1-hour period, the price fell 7.82%, and trading volume decreased 2.14% month-on-month; however, the current unfinished hour has bounced 17.75% from the previous hour’s close. Over the past nearly 4 hours, it is still down 22.88%, but trading volume is up 44.41% compared with the prior 4 hours—short-term activity shows a surge followed by intense, volatile contention.
Quantity OI has increased 2.30% in the last hour, and the 30-point window has increased 51.96%. The Funding indicator is +0.1756%, and the most recent realized settlement is +0.2149%. Positions continue to expand, and long holders’ average costs are relatively high. Since OI can’t determine the direction of new positions, positive Funding does not necessarily mean the price must drop.
I place more emphasis on confirmation within a full hour. If the close can hold above 0.04673, and OI and trading volume continue to expand, then the rebound has a basis to continue. If it breaks back below 0.03922 while OI contracts, high-level deleveraging may accelerate again. With the 24-hour gain nearing a doubling, when chasing price or trying to top in the face of the trend, leverage must be kept under control.
In the previous complete 1-hour period, the price fell 7.82%, and trading volume decreased 2.14% month-on-month; however, the current unfinished hour has bounced 17.75% from the previous hour’s close. Over the past nearly 4 hours, it is still down 22.88%, but trading volume is up 44.41% compared with the prior 4 hours—short-term activity shows a surge followed by intense, volatile contention.
Quantity OI has increased 2.30% in the last hour, and the 30-point window has increased 51.96%. The Funding indicator is +0.1756%, and the most recent realized settlement is +0.2149%. Positions continue to expand, and long holders’ average costs are relatively high. Since OI can’t determine the direction of new positions, positive Funding does not necessarily mean the price must drop.
I place more emphasis on confirmation within a full hour. If the close can hold above 0.04673, and OI and trading volume continue to expand, then the rebound has a basis to continue. If it breaks back below 0.03922 while OI contracts, high-level deleveraging may accelerate again. With the 24-hour gain nearing a doubling, when chasing price or trying to top in the face of the trend, leverage must be kept under control.
641
Another day of waking up early to刷 #ALPHA . ☕
Yesterday I went out for a walk during the day (my husband dragged me back and forth—10 kilometers, I’m impressed), and at night when I got home $DGAI was still not stable. So I had to get up early and keep刷ing. But then... just now it still didn’t seem very stable, and in the end I磨损 65,000 by 3.49—pretty good, not bad.
The sunshine right now is too nice. I’m going to meditate for a bit and kick off this beautiful Sunday!
By the way, everyone—what tier are you all刷ing Alpha on right now?
Will we be able to get some big juicy wins during the holiday week!
Another day of waking up early to刷 #ALPHA . ☕
Yesterday I went out for a walk during the day (my husband dragged me back and forth—10 kilometers, I’m impressed), and at night when I got home $DGAI was still not stable. So I had to get up early and keep刷ing. But then... just now it still didn’t seem very stable, and in the end I磨损 65,000 by 3.49—pretty good, not bad.
The sunshine right now is too nice. I’m going to meditate for a bit and kick off this beautiful Sunday!
By the way, everyone—what tier are you all刷ing Alpha on right now?
Will we be able to get some big juicy wins during the holiday week!
Yesterday I went out for a walk during the day (my husband dragged me back and forth—10 kilometers, I’m impressed), and at night when I got home $DGAI was still not stable. So I had to get up early and keep刷ing. But then... just now it still didn’t seem very stable, and in the end I磨损 65,000 by 3.49—pretty good, not bad.
The sunshine right now is too nice. I’m going to meditate for a bit and kick off this beautiful Sunday!
By the way, everyone—what tier are you all刷ing Alpha on right now?
Will we be able to get some big juicy wins during the holiday week!
6
940
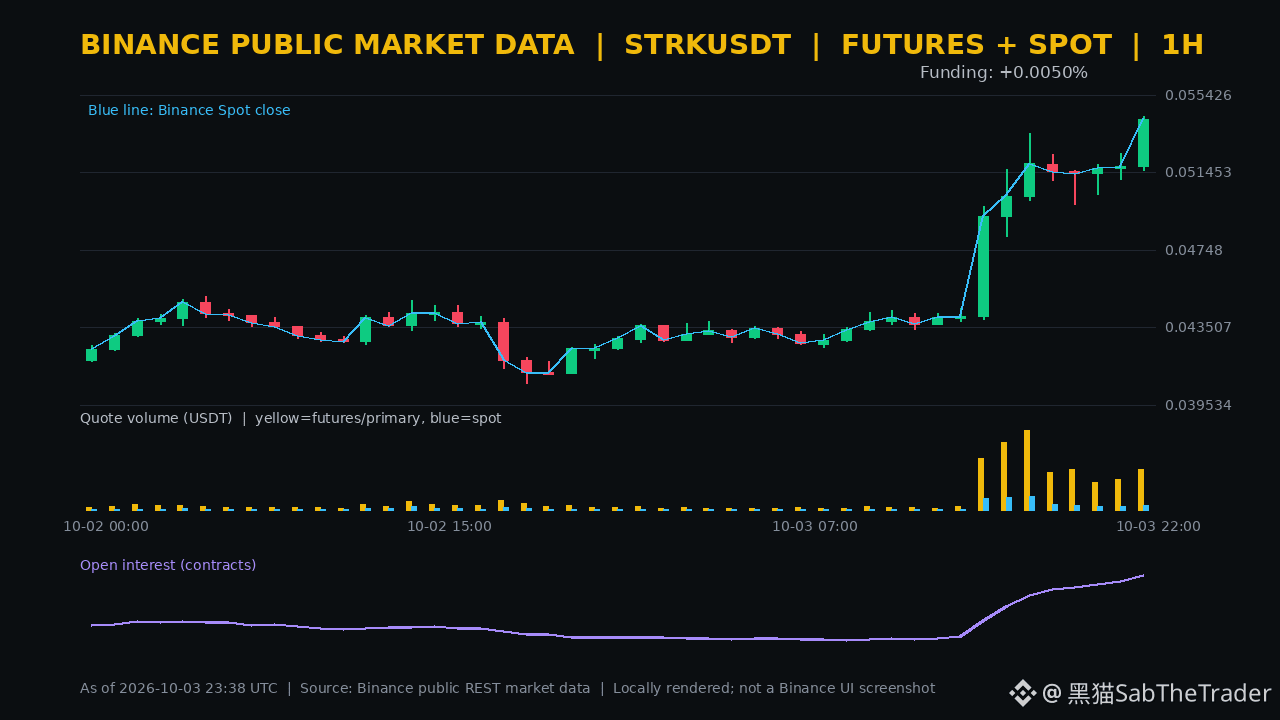
Short-term strength has returned to the full hourly line. According to public Binance data at 07:37 (UTC+8), spot and perpetual for $STRK have risen 28.18% and 28.24% over the past 24 hours, respectively. The latest prices are about 0.05509 and 0.05508, and the perpetual 24-hour trading volume is approximately 103 million USDT.
In the previous complete 1-hour period, spot and perpetual rose by 4.75% and 4.72%, respectively, while trading volume increased quarter-over-quarter by 25.50% and 32.62%. Perpetual is still up 5.24% over the last four hours; however, its trading volume over the last four hours decreased by 41.38% compared with the prior four hours. Price-volume action is expanding, but the mid-point volume support has not yet caught up—this is the divergence to watch for before chasing the rally.
Quantity OI increased by 2.74% in the most recent hour; within a 30-point window it increased by 26.84%. Funding indications and the most recent actual settlement are both +0.0050%. Price, volume, and positioning have all moved upward in sync, but the fee rate has not yet shown extreme crowding; quantity OI also cannot determine the direction of newly added positions.
The current unfinished hour is already about 1.66% higher than the previous hour’s close. If the full hour can hold above 0.05433, and both成交量 and OI continue to expand moderately, then the strong structure can be considered as continuing. If it breaks below 0.05158 and is accompanied by OI contraction, then it is necessary to prioritize guarding against deleveraging at higher levels.
Short-term strength has returned to the full hourly line. According to public Binance data at 07:37 (UTC+8), spot and perpetual for $STRK have risen 28.18% and 28.24% over the past 24 hours, respectively. The latest prices are about 0.05509 and 0.05508, and the perpetual 24-hour trading volume is approximately 103 million USDT.
In the previous complete 1-hour period, spot and perpetual rose by 4.75% and 4.72%, respectively, while trading volume increased quarter-over-quarter by 25.50% and 32.62%. Perpetual is still up 5.24% over the last four hours; however, its trading volume over the last four hours decreased by 41.38% compared with the prior four hours. Price-volume action is expanding, but the mid-point volume support has not yet caught up—this is the divergence to watch for before chasing the rally.
Quantity OI increased by 2.74% in the most recent hour; within a 30-point window it increased by 26.84%. Funding indications and the most recent actual settlement are both +0.0050%. Price, volume, and positioning have all moved upward in sync, but the fee rate has not yet shown extreme crowding; quantity OI also cannot determine the direction of newly added positions.
The current unfinished hour is already about 1.66% higher than the previous hour’s close. If the full hour can hold above 0.05433, and both成交量 and OI continue to expand moderately, then the strong structure can be considered as continuing. If it breaks below 0.05158 and is accompanied by OI contraction, then it is necessary to prioritize guarding against deleveraging at higher levels.
In the previous complete 1-hour period, spot and perpetual rose by 4.75% and 4.72%, respectively, while trading volume increased quarter-over-quarter by 25.50% and 32.62%. Perpetual is still up 5.24% over the last four hours; however, its trading volume over the last four hours decreased by 41.38% compared with the prior four hours. Price-volume action is expanding, but the mid-point volume support has not yet caught up—this is the divergence to watch for before chasing the rally.
Quantity OI increased by 2.74% in the most recent hour; within a 30-point window it increased by 26.84%. Funding indications and the most recent actual settlement are both +0.0050%. Price, volume, and positioning have all moved upward in sync, but the fee rate has not yet shown extreme crowding; quantity OI also cannot determine the direction of newly added positions.
The current unfinished hour is already about 1.66% higher than the previous hour’s close. If the full hour can hold above 0.05433, and both成交量 and OI continue to expand moderately, then the strong structure can be considered as continuing. If it breaks below 0.05158 and is accompanied by OI contraction, then it is necessary to prioritize guarding against deleveraging at higher levels.
741
🙈 After $BTC surged to 87,000 USD last night and then dropped again, those who chased the price are probably feeling a bit uncomfortable.
News can push the price up, but whether it can hold depends on the follow-through from incoming buy orders.
I’ll watch when it comes close to 87k again to see if it can break through and then hold after a pullback; if it keeps making higher pushes only to be pressured back down, then I’ll lower expectations for the continuation of the uptrend.
Also don’t ignore volatility when chasing options/contracts over the weekend—if you’re right about the direction but your position is too heavy, you can still get swept out~
#比特币冲击8.7万美元遇阻回落
🙈 After $BTC surged to 87,000 USD last night and then dropped again, those who chased the price are probably feeling a bit uncomfortable.
News can push the price up, but whether it can hold depends on the follow-through from incoming buy orders.
I’ll watch when it comes close to 87k again to see if it can break through and then hold after a pullback; if it keeps making higher pushes only to be pressured back down, then I’ll lower expectations for the continuation of the uptrend.
Also don’t ignore volatility when chasing options/contracts over the weekend—if you’re right about the direction but your position is too heavy, you can still get swept out~
#比特币冲击8.7万美元遇阻回落
News can push the price up, but whether it can hold depends on the follow-through from incoming buy orders.
I’ll watch when it comes close to 87k again to see if it can break through and then hold after a pullback; if it keeps making higher pushes only to be pressured back down, then I’ll lower expectations for the continuation of the uptrend.
Also don’t ignore volatility when chasing options/contracts over the weekend—if you’re right about the direction but your position is too heavy, you can still get swept out~
#比特币冲击8.7万美元遇阻回落

706
13
52
706
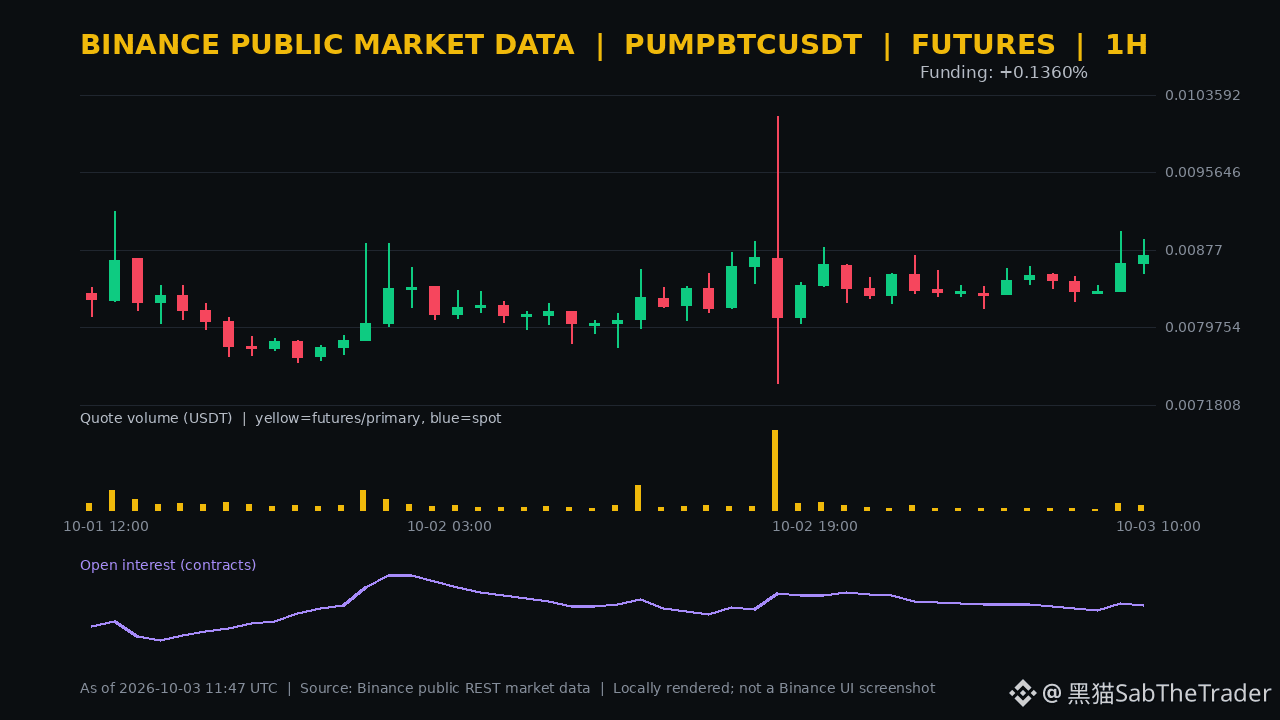
Near delisting, it suddenly surged. This PUMPBTC move looks more like a liquidity and positioning tug-of-war, so you shouldn’t just chase the price based on percentage gains. As of 19:47 (UTC+8), Binance’s perpetual contract public data shows that $PUMPBTC is at 0.00978, up 22.71% over the past 24 hours, with a peak of 0.01014. The contract will be automatically settled and delisted at 17:00 on October 5.
In the previous complete hour, it rose only 0.93%, and trading volume actually fell 34.35% quarter-over-quarter. However, the not-yet-closed hour is already up about 12.28% compared with the previous hour’s closing price. When the price accelerates, OI (open interest) has dropped 0.39% over the last hour and 3.09% in the 30-point window; the Funding rate has risen to +0.1360%, while the most recent actual settlement was +0.0845%. The rise hasn’t been accompanied by OI expansion—it’s more like a squeeze resulting from short covering, position reductions, or liquidity contraction as delisting approaches. OI itself can’t distinguish between long and short direction.
I’ll first see whether 0.01014 can hold after a complete-hour close. If, during the push higher, OI keeps falling and trading can’t sustain, the downside risk will amplify quickly. If it drops back to 0.00871, and especially if it breaks 0.00853, that would indicate this acceleration lacks follow-through. With only two days left until delisting, the priority should be the risks of liquidation, ADL, and thinner order books—not directional guessing.
Near delisting, it suddenly surged. This PUMPBTC move looks more like a liquidity and positioning tug-of-war, so you shouldn’t just chase the price based on percentage gains. As of 19:47 (UTC+8), Binance’s perpetual contract public data shows that $PUMPBTC is at 0.00978, up 22.71% over the past 24 hours, with a peak of 0.01014. The contract will be automatically settled and delisted at 17:00 on October 5.
In the previous complete hour, it rose only 0.93%, and trading volume actually fell 34.35% quarter-over-quarter. However, the not-yet-closed hour is already up about 12.28% compared with the previous hour’s closing price. When the price accelerates, OI (open interest) has dropped 0.39% over the last hour and 3.09% in the 30-point window; the Funding rate has risen to +0.1360%, while the most recent actual settlement was +0.0845%. The rise hasn’t been accompanied by OI expansion—it’s more like a squeeze resulting from short covering, position reductions, or liquidity contraction as delisting approaches. OI itself can’t distinguish between long and short direction.
I’ll first see whether 0.01014 can hold after a complete-hour close. If, during the push higher, OI keeps falling and trading can’t sustain, the downside risk will amplify quickly. If it drops back to 0.00871, and especially if it breaks 0.00853, that would indicate this acceleration lacks follow-through. With only two days left until delisting, the priority should be the risks of liquidation, ADL, and thinner order books—not directional guessing.
In the previous complete hour, it rose only 0.93%, and trading volume actually fell 34.35% quarter-over-quarter. However, the not-yet-closed hour is already up about 12.28% compared with the previous hour’s closing price. When the price accelerates, OI (open interest) has dropped 0.39% over the last hour and 3.09% in the 30-point window; the Funding rate has risen to +0.1360%, while the most recent actual settlement was +0.0845%. The rise hasn’t been accompanied by OI expansion—it’s more like a squeeze resulting from short covering, position reductions, or liquidity contraction as delisting approaches. OI itself can’t distinguish between long and short direction.
I’ll first see whether 0.01014 can hold after a complete-hour close. If, during the push higher, OI keeps falling and trading can’t sustain, the downside risk will amplify quickly. If it drops back to 0.00871, and especially if it breaks 0.00853, that would indicate this acceleration lacks follow-through. With only two days left until delisting, the priority should be the risks of liquidation, ADL, and thinner order books—not directional guessing.
678
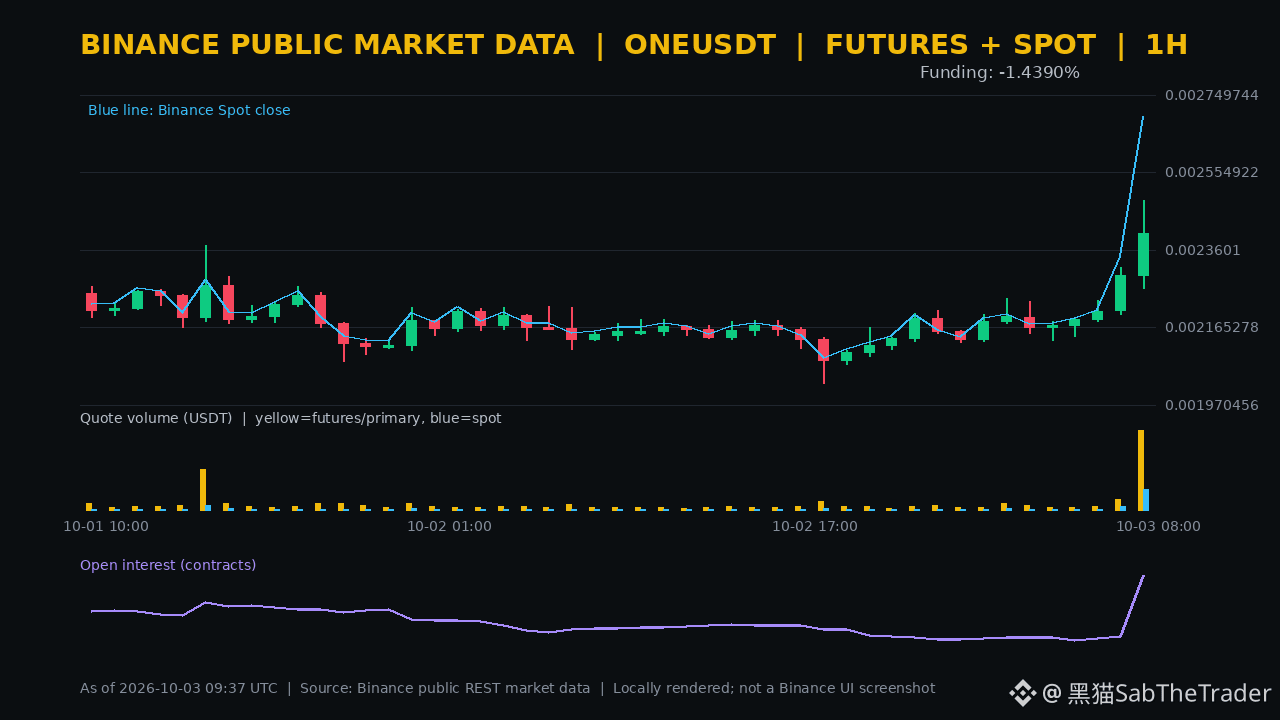
In this latest surge (ONE), spot and perpetuals have not fully moved in sync. Public Binance data at 17:36 (UTC+8) shows spot is up 28.77% over the past 24 hours, while perpetuals are up 16.06%. The roughly 13-percentage-point gap between the two—represented by $ONE —suggests spot buyers are stronger, and the futures market is still caught in a tug-of-war between lagging catch-up and short/long squeeze positioning.
In the previous complete hour, the perpetuals rose from 0.0022962 to 0.0024015, up 4.59%, with trading volume increasing by 685.96% month-over-month. Meanwhile, open interest (OI) also rose in that hour by 21.13%, and the 30-point window increased by 15.07%. Price, trading activity, and positioning all expanded together, but the Funding indicator fell to -1.4188%; the most recent actual settlement was only -0.0172%. The discrepancy between the two is large, so you cannot simply treat intraday extreme Funding values as the next settlement outcome.
I will first use the previous full hour’s range of 0.0022621–0.0024854 to assess how well the market holds. If the price stays above 0.0024854, trading remains strong, and OI does not rise sharply further, the upward structure is healthier. If it falls back below 0.0022621 while OI rapidly contracts, it looks more like crowded positions are being unwound. The current hour is not finished yet, so I’ll wait for confirmation.
In this latest surge (ONE), spot and perpetuals have not fully moved in sync. Public Binance data at 17:36 (UTC+8) shows spot is up 28.77% over the past 24 hours, while perpetuals are up 16.06%. The roughly 13-percentage-point gap between the two—represented by $ONE —suggests spot buyers are stronger, and the futures market is still caught in a tug-of-war between lagging catch-up and short/long squeeze positioning.
In the previous complete hour, the perpetuals rose from 0.0022962 to 0.0024015, up 4.59%, with trading volume increasing by 685.96% month-over-month. Meanwhile, open interest (OI) also rose in that hour by 21.13%, and the 30-point window increased by 15.07%. Price, trading activity, and positioning all expanded together, but the Funding indicator fell to -1.4188%; the most recent actual settlement was only -0.0172%. The discrepancy between the two is large, so you cannot simply treat intraday extreme Funding values as the next settlement outcome.
I will first use the previous full hour’s range of 0.0022621–0.0024854 to assess how well the market holds. If the price stays above 0.0024854, trading remains strong, and OI does not rise sharply further, the upward structure is healthier. If it falls back below 0.0022621 while OI rapidly contracts, it looks more like crowded positions are being unwound. The current hour is not finished yet, so I’ll wait for confirmation.
In the previous complete hour, the perpetuals rose from 0.0022962 to 0.0024015, up 4.59%, with trading volume increasing by 685.96% month-over-month. Meanwhile, open interest (OI) also rose in that hour by 21.13%, and the 30-point window increased by 15.07%. Price, trading activity, and positioning all expanded together, but the Funding indicator fell to -1.4188%; the most recent actual settlement was only -0.0172%. The discrepancy between the two is large, so you cannot simply treat intraday extreme Funding values as the next settlement outcome.
I will first use the previous full hour’s range of 0.0022621–0.0024854 to assess how well the market holds. If the price stays above 0.0024854, trading remains strong, and OI does not rise sharply further, the upward structure is healthier. If it falls back below 0.0022621 while OI rapidly contracts, it looks more like crowded positions are being unwound. The current hour is not finished yet, so I’ll wait for confirmation.
527
Verified
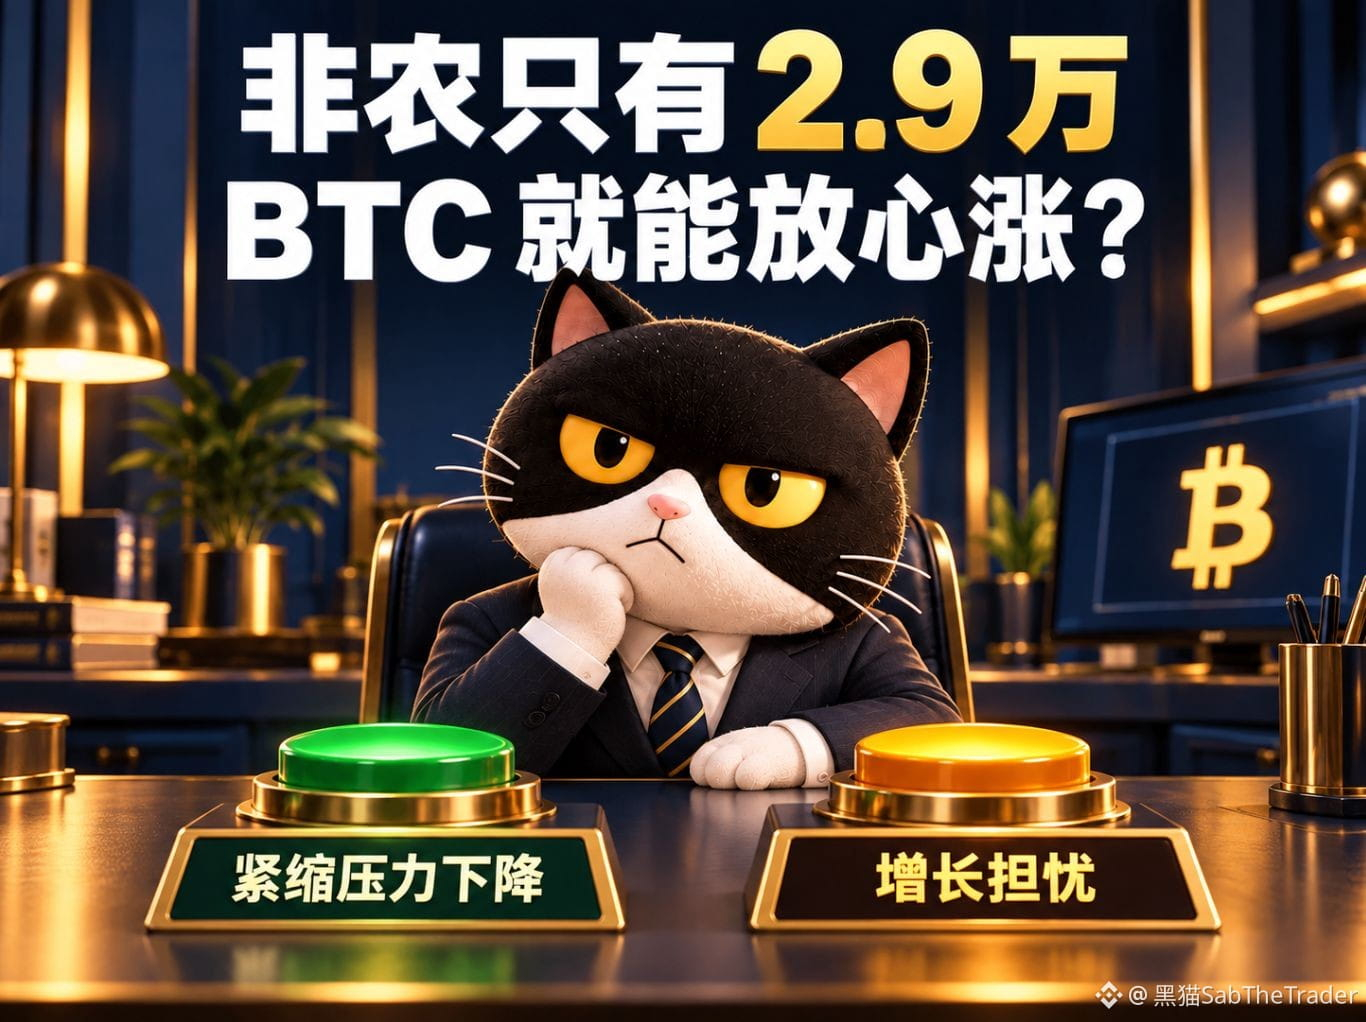
Only 29,000 in nonfarm payrolls—can the crypto market feel safe to surge? 👀
Last night, the U.S. September nonfarm payrolls added only 29,000 jobs, clearly below Reuters’ survey expectation of 90,000. Even more noteworthy, the combined data for July and August was revised down by another 60,000.
Seeing this, many people’s first reaction might be: employment is weakening, the Fed should cut rates—<a>$BTC </a> is bullish.
I think that conclusion is a step too fast.
Nonfarm payrolls can be understood as how many non-agricultural jobs the U.S. added this month. The low number of new jobs suggests hiring momentum is weak. The downward revisions from the prior two months also remind us that the employment picture we initially saw was not as strong as first reported.
Wages are also cooling: average hourly earnings rose only 0.1% month over month, and 3.0% year over year. Slower wage growth means inflation pressure driven by wages may be easing.
The issue is that the Fed also looks at prices of goods, housing, energy, and more. A cooling labor market may influence policy thinking, but a single nonfarm report is not enough to directly conclude that the Fed will definitely cut rates next.
For crypto, in the short term, you can watch whether rate-hike worries ease. Over a longer horizon, we need to see whether weaker employment gradually affects consumption and corporate earnings.
With the same weak data, the market might first price in falling tightening pressure, or it might later start worrying about economic growth. The timing and strength of these two effects still need to be observed.
Next, I’m going to shift my focus back to price:
If BTC can break above the recent high, and after a pullback it continues to hold, then there’s more reason to monitor whether the uptrend can extend. Give a reason with the news, and get confirmation from follow-through.
If it spikes higher and then falls back into the previous consolidation range, and the rebound still can’t get back on track, I’ll lower my expectations for the impact of this news. Especially when chasing with futures— even if your direction is right, you might still get swept out by volatility. 🙈
Also, the unemployment rate of 4.2% by itself can’t directly be read as “the U.S. economy suddenly collapsing.” The official report notes that since March, the unemployment rate has stayed in a narrow range of 4.1% to 4.3%.
So this time I’m more inclined to interpret it as: employment is adding more caution to continued tightening, and we’ll need to keep watching the inflation data and overall price performance afterward.
Do you think this nonfarm report can provide sustained momentum for BTC, or is it only enough for a short-term swing of sentiment?
*NFA, DYOR
#非农就业数据
Only 29,000 in nonfarm payrolls—can the crypto market feel safe to surge? 👀
Last night, the U.S. September nonfarm payrolls added only 29,000 jobs, clearly below Reuters’ survey expectation of 90,000. Even more noteworthy, the combined data for July and August was revised down by another 60,000.
Seeing this, many people’s first reaction might be: employment is weakening, the Fed should cut rates—<a>$BTC </a> is bullish.
I think that conclusion is a step too fast.
Nonfarm payrolls can be understood as how many non-agricultural jobs the U.S. added this month. The low number of new jobs suggests hiring momentum is weak. The downward revisions from the prior two months also remind us that the employment picture we initially saw was not as strong as first reported.
Wages are also cooling: average hourly earnings rose only 0.1% month over month, and 3.0% year over year. Slower wage growth means inflation pressure driven by wages may be easing.
The issue is that the Fed also looks at prices of goods, housing, energy, and more. A cooling labor market may influence policy thinking, but a single nonfarm report is not enough to directly conclude that the Fed will definitely cut rates next.
For crypto, in the short term, you can watch whether rate-hike worries ease. Over a longer horizon, we need to see whether weaker employment gradually affects consumption and corporate earnings.
With the same weak data, the market might first price in falling tightening pressure, or it might later start worrying about economic growth. The timing and strength of these two effects still need to be observed.
Next, I’m going to shift my focus back to price:
If BTC can break above the recent high, and after a pullback it continues to hold, then there’s more reason to monitor whether the uptrend can extend. Give a reason with the news, and get confirmation from follow-through.
If it spikes higher and then falls back into the previous consolidation range, and the rebound still can’t get back on track, I’ll lower my expectations for the impact of this news. Especially when chasing with futures— even if your direction is right, you might still get swept out by volatility. 🙈
Also, the unemployment rate of 4.2% by itself can’t directly be read as “the U.S. economy suddenly collapsing.” The official report notes that since March, the unemployment rate has stayed in a narrow range of 4.1% to 4.3%.
So this time I’m more inclined to interpret it as: employment is adding more caution to continued tightening, and we’ll need to keep watching the inflation data and overall price performance afterward.
Do you think this nonfarm report can provide sustained momentum for BTC, or is it only enough for a short-term swing of sentiment?
*NFA, DYOR
#非农就业数据
Last night, the U.S. September nonfarm payrolls added only 29,000 jobs, clearly below Reuters’ survey expectation of 90,000. Even more noteworthy, the combined data for July and August was revised down by another 60,000.
Seeing this, many people’s first reaction might be: employment is weakening, the Fed should cut rates—<a>$BTC </a> is bullish.
I think that conclusion is a step too fast.
Nonfarm payrolls can be understood as how many non-agricultural jobs the U.S. added this month. The low number of new jobs suggests hiring momentum is weak. The downward revisions from the prior two months also remind us that the employment picture we initially saw was not as strong as first reported.
Wages are also cooling: average hourly earnings rose only 0.1% month over month, and 3.0% year over year. Slower wage growth means inflation pressure driven by wages may be easing.
The issue is that the Fed also looks at prices of goods, housing, energy, and more. A cooling labor market may influence policy thinking, but a single nonfarm report is not enough to directly conclude that the Fed will definitely cut rates next.
For crypto, in the short term, you can watch whether rate-hike worries ease. Over a longer horizon, we need to see whether weaker employment gradually affects consumption and corporate earnings.
With the same weak data, the market might first price in falling tightening pressure, or it might later start worrying about economic growth. The timing and strength of these two effects still need to be observed.
Next, I’m going to shift my focus back to price:
If BTC can break above the recent high, and after a pullback it continues to hold, then there’s more reason to monitor whether the uptrend can extend. Give a reason with the news, and get confirmation from follow-through.
If it spikes higher and then falls back into the previous consolidation range, and the rebound still can’t get back on track, I’ll lower my expectations for the impact of this news. Especially when chasing with futures— even if your direction is right, you might still get swept out by volatility. 🙈
Also, the unemployment rate of 4.2% by itself can’t directly be read as “the U.S. economy suddenly collapsing.” The official report notes that since March, the unemployment rate has stayed in a narrow range of 4.1% to 4.3%.
So this time I’m more inclined to interpret it as: employment is adding more caution to continued tightening, and we’ll need to keep watching the inflation data and overall price performance afterward.
Do you think this nonfarm report can provide sustained momentum for BTC, or is it only enough for a short-term swing of sentiment?
*NFA, DYOR
#非农就业数据
1
1
294
Log in to explore more content
Join global crypto users on Binance Square
⚡️ Get latest and useful information about crypto.
💬 Trusted by the world’s largest crypto exchange.
👍 Discover real insights from verified creators.
Email / Phone number
Trending Topics
ADAGains10%Above$0.27
2,546 views
94 Discussing
#ADAGains10%Above$0.27
$ADA IS FINALLY WAKING UP 👀
Cardano's $ADA just jumped 10% in 24 hours, pushing above $0.27 for the first time since May.
The move comes as attention builds around Cardano's RealFi ecosystem and the upcoming Dijkstra scalability upgrade.
After months of slow price action, $ADA is suddenly back on traders' radar.
#ADA #Cardano #crypto #altcoins
Albertc07
·2 Likes
·220 views
ETHUp70%InQ3ButLiquidityFalls
31,098 views
485 Discussing
EthStakingExitQueueHits2026High
12,296 views
429 Discussing