Closely monitor the price movement $MOVR across the timeframes
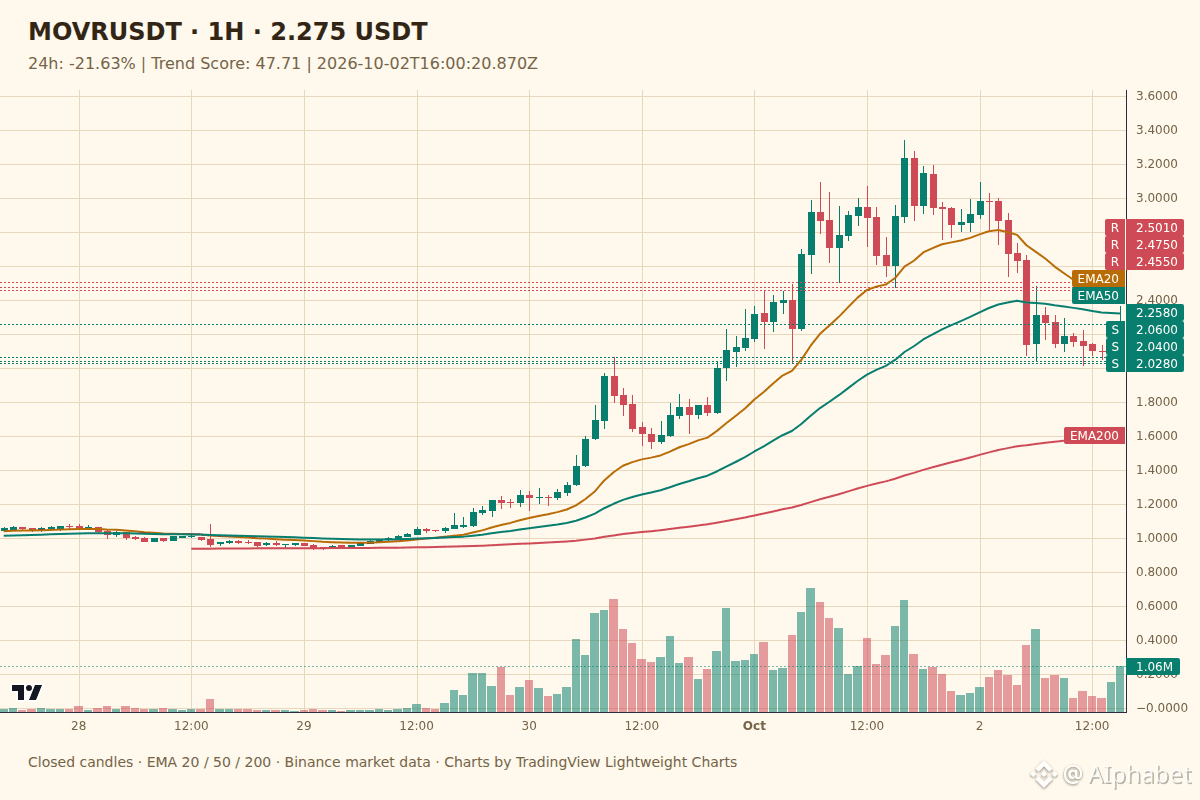
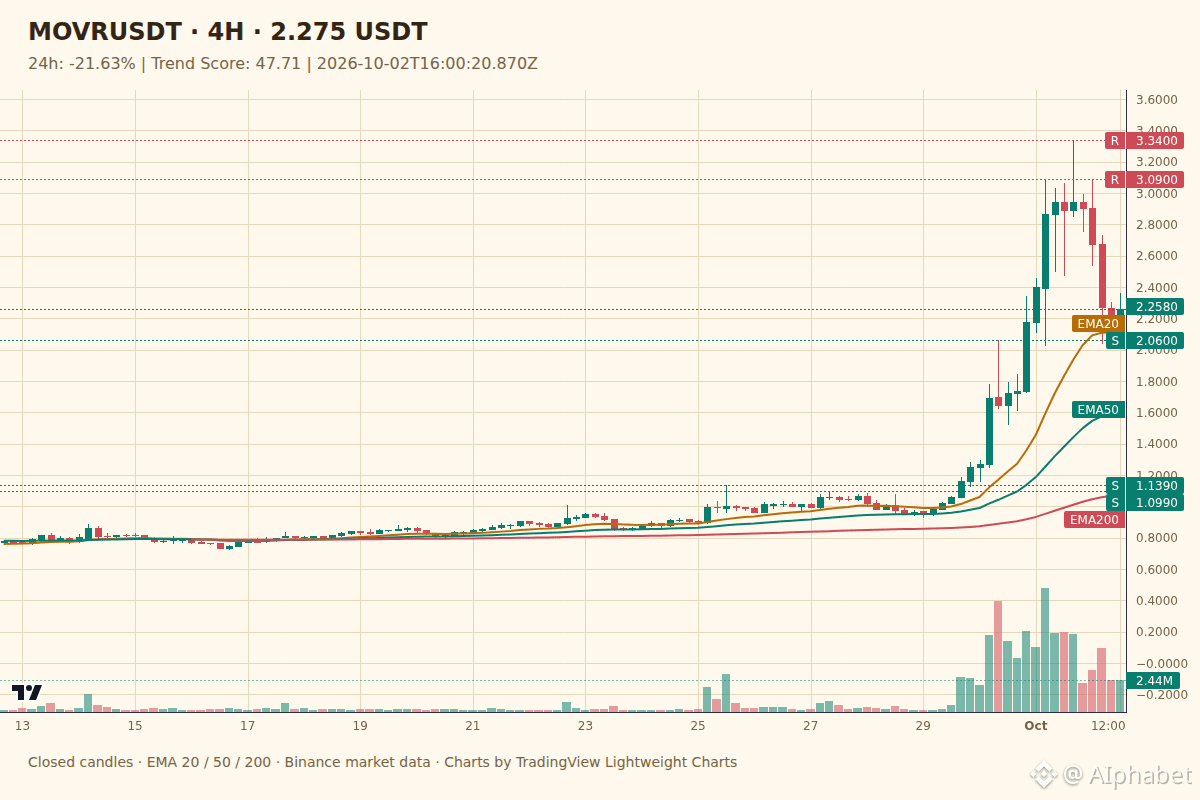
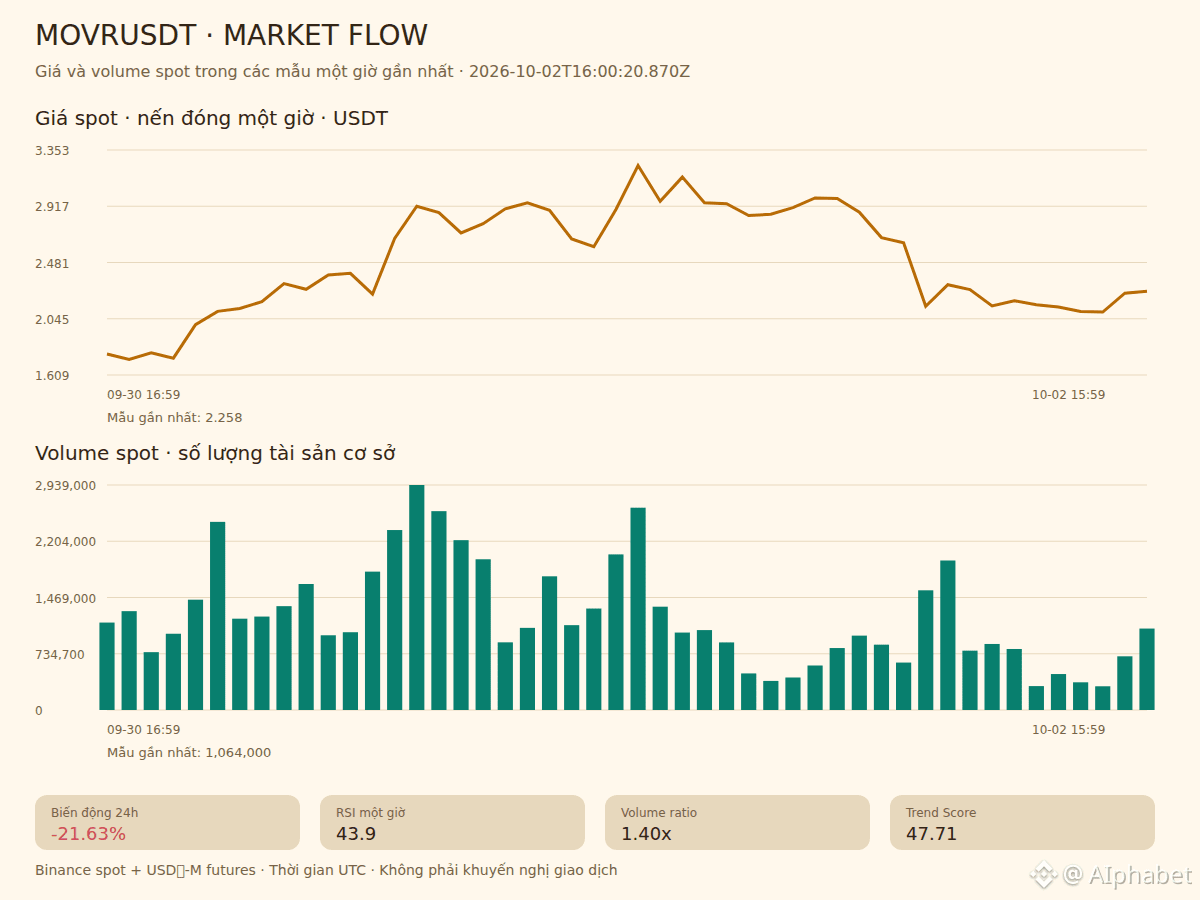
Let’s take a look at the chart $MOVR right now to see where the current volatility-led momentum is taking the market. 📉 📊
• $MOVR records a price of 2.275, with trading volume on the 1-hour timeframe reaching 1.40x the average, indicating a fairly clear consolidation phase and that buyers and sellers are fiercely battling in this price zone.
• If buying pressure returns and pushes the price above resistance 2.292, the short-term uptrend could continue to strengthen further, supported by volume agreement on the chart.
• Conversely, if selling pressure keeps overwhelming and breaks through the support zone at 2.06, the price risks dropping further to lower levels amid technical indicators that are not yet truly stable.
Be cautious about two-way sweep moves when Open Interest fluctuates strongly around 5892477 USDT and the position ratio may change unexpectedly.
#MOVR #Crypto
Let’s take a look at the chart $MOVR right now to see where the current volatility-led momentum is taking the market. 📉 📊
• $MOVR records a price of 2.275, with trading volume on the 1-hour timeframe reaching 1.40x the average, indicating a fairly clear consolidation phase and that buyers and sellers are fiercely battling in this price zone.
• If buying pressure returns and pushes the price above resistance 2.292, the short-term uptrend could continue to strengthen further, supported by volume agreement on the chart.
• Conversely, if selling pressure keeps overwhelming and breaks through the support zone at 2.06, the price risks dropping further to lower levels amid technical indicators that are not yet truly stable.
Be cautious about two-way sweep moves when Open Interest fluctuates strongly around 5892477 USDT and the position ratio may change unexpectedly.
#MOVR #Crypto