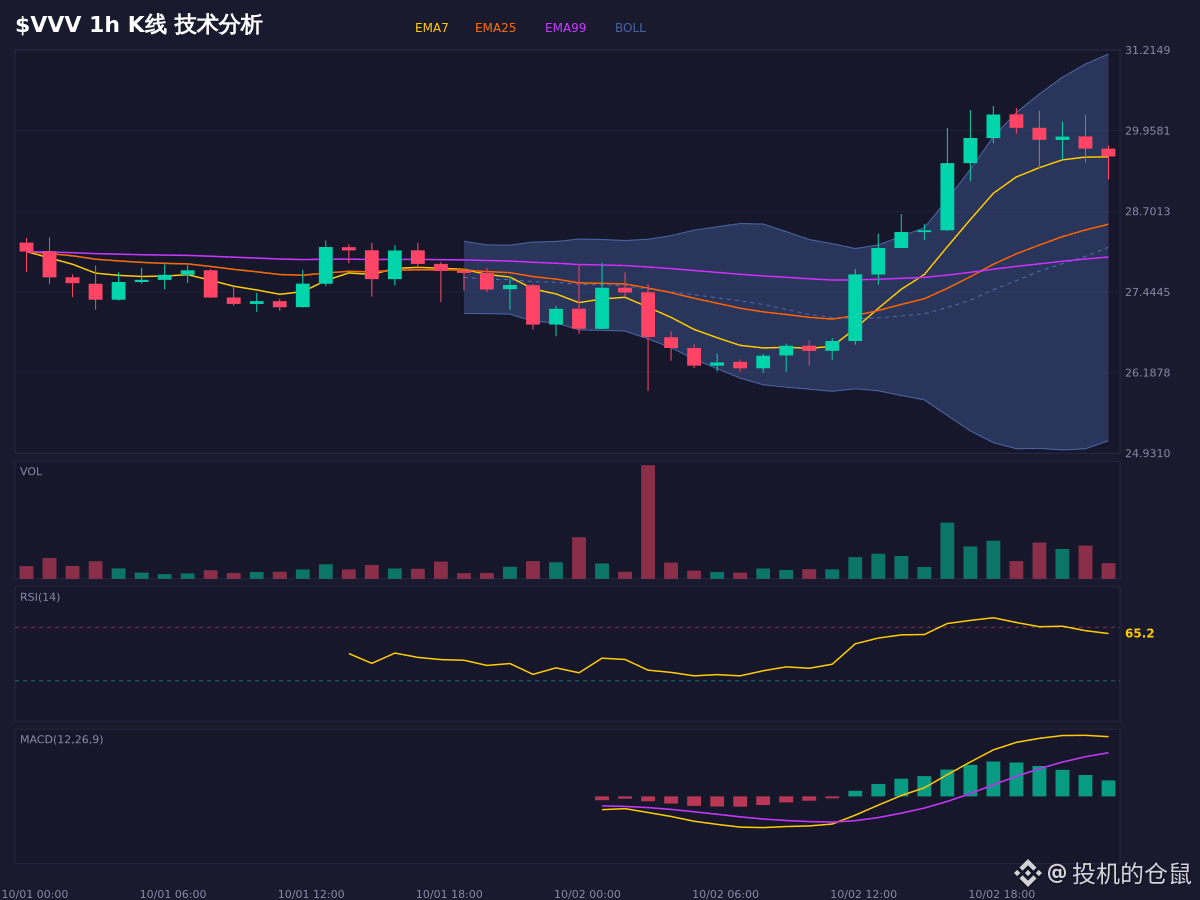
$VVV This move really has something, but if you look closely at a few key indicators, it’s quite interesting.
The moving average system is clearly in a bullish alignment. EMA7 is already above EMA25, indicating the trend is fairly strong. However, the MACD histogram bars are shrinking, suggesting the bullish momentum is starting to weaken—this is the first point to watch.
RSI is still within a healthy range, but Stoch RSI shows a signal of the K line crossing below the D line, which is a short-term bearish divergence and should be treated with caution. Usually, this kind of setup either first pulls back to confirm support before continuing stronger, or turns around directly.
The support zone is between 28.12 and 28.64, especially around EMA25 at ~28.49. If price holds in this area, the bullish structure may still continue; but if it breaks below the key level around 27.27, the current logic will no longer hold.
For chart observation and scenario analysis only; this is not a record of trading actions.
$VVV #现货 #永续合约 #bear market
The moving average system is clearly in a bullish alignment. EMA7 is already above EMA25, indicating the trend is fairly strong. However, the MACD histogram bars are shrinking, suggesting the bullish momentum is starting to weaken—this is the first point to watch.
RSI is still within a healthy range, but Stoch RSI shows a signal of the K line crossing below the D line, which is a short-term bearish divergence and should be treated with caution. Usually, this kind of setup either first pulls back to confirm support before continuing stronger, or turns around directly.
The support zone is between 28.12 and 28.64, especially around EMA25 at ~28.49. If price holds in this area, the bullish structure may still continue; but if it breaks below the key level around 27.27, the current logic will no longer hold.
For chart observation and scenario analysis only; this is not a record of trading actions.
$VVV #现货 #永续合约 #bear market