


💡 Current price situation:
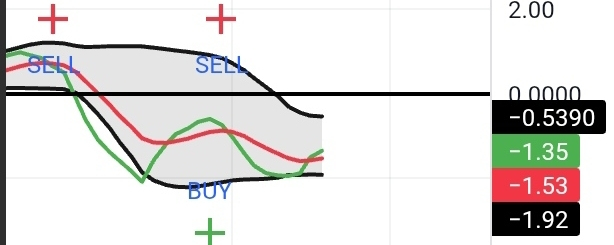
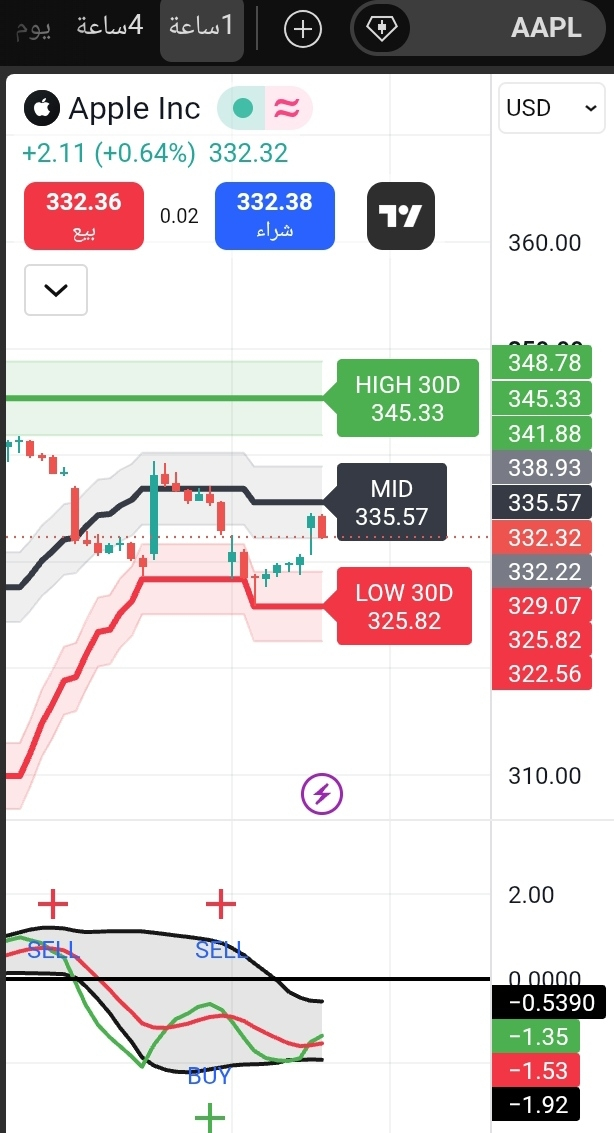
The price is currently trading at $332.32, as the chart clearly shows an attempt to build bullish momentum after stabilizing above the recent support levels, supported by the appearance of a BUY signal (buy) at the bottom on the lower indicator.
🔍 Key technical data (according to indicators):
Monthly resistance (HIGH 30D): is at the levels of $345.33 up to the peak of $348.78.
The central pivot (MID): centered at $335.57, and it represents the decisive turning point for the price to move.
Monthly support (LOW 30D): firmly stands at $325.82, serving as a safety valve to prevent a decline.
###🎯 Proposed Trading Plan and Recommendation:
📌 Current strategy: buy with confirmation (Breakout Buy)
🟢 Safe entry price: when breaking and holding above $335.57 (the MID point) to ensure the sideways correction is over.
🎯 First target: $341.88
🎯 Second target: $345.33
🎯 Main target: $348.78
🛑 Stop loss (SL): closing below the support level of $325.82 (LOW 30D).
⚠️ Disclaimer: This analysis is for educational and guidance purposes only, based solely on the indicators shown on the chart, and does not constitute direct financial advice. Always act according to strict risk/capital management.
#AAPL #Apple #Stocks #TechnicalAnalysis #TradingTips