$WLFI This one is a bit interesting.
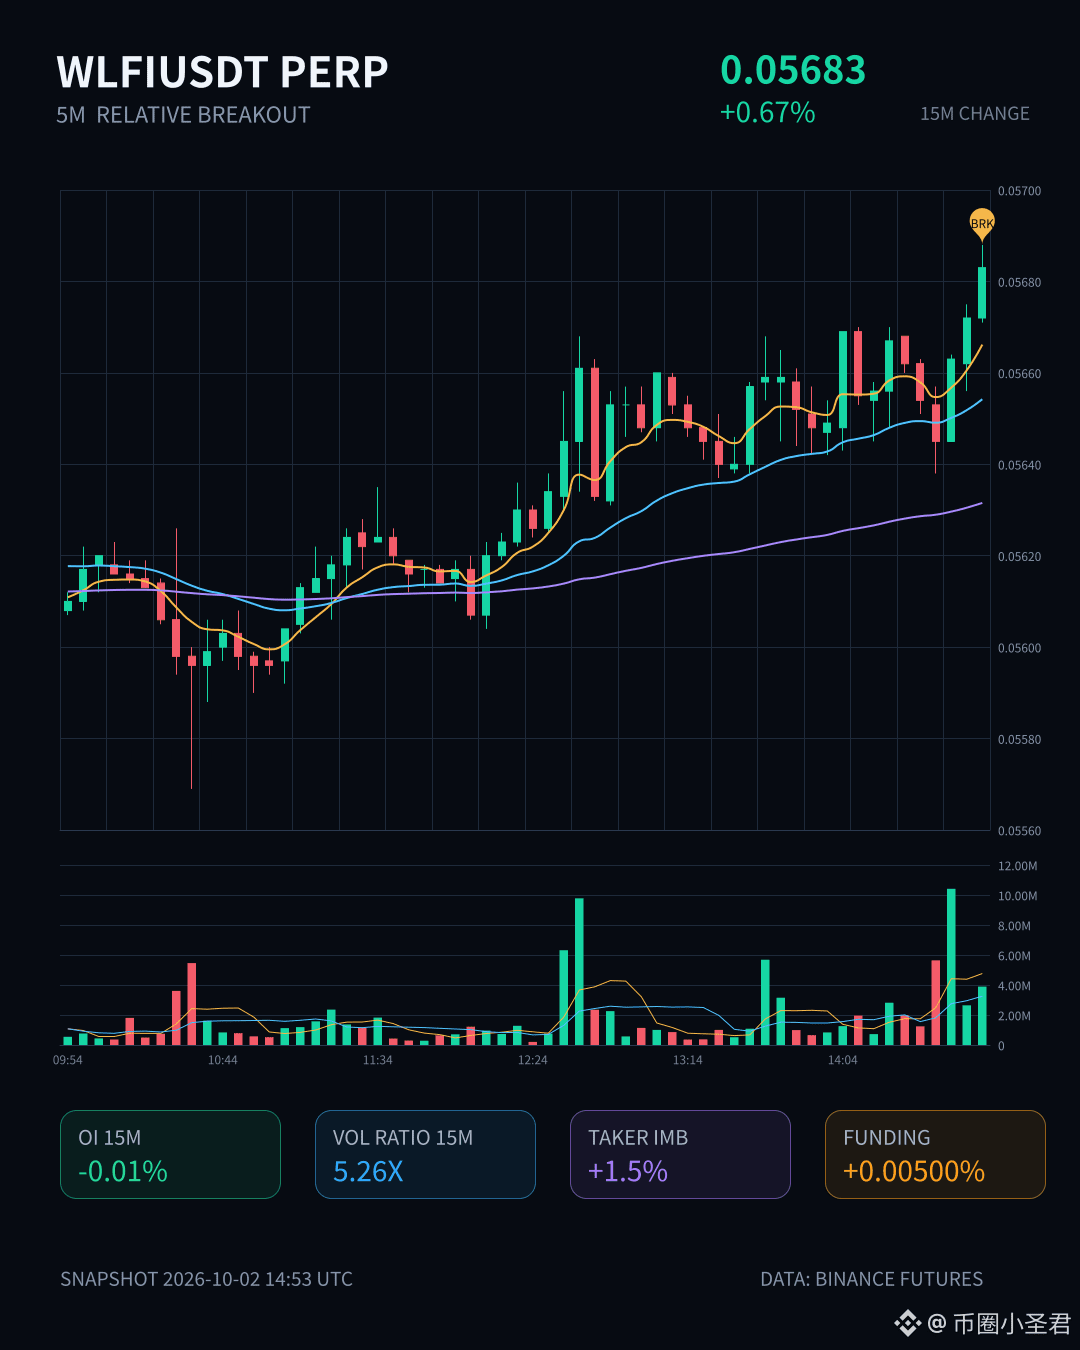
On the 15m chart it’s up 0.67%, and the volume was pushed straight to 5.26x. The closing price broke above the upper edge of the most recent 20 5m-range interval. But OI is dropping instead—on the 15m -0.01%, on the 1h -0.02%. The abnormal percentile is inverted at 98.6%, and the whole pool is abnormal #3.
Price is rising while positions are decreasing—this is a typical short-covering flow, not fresh long entries. Active trading is also only 1.5%, the buy/sell ratio is 1.03, and there isn’t much appetite for chasing.
With this structure, I generally don’t dare to chase. After the squeeze is pushed up, I’ll wait for the covering to finish and then see the follow-through. In the last 24h, turnover is under 17 million, the pool isn’t deep, so there’s pin-risk and it needs to be accounted for.
First, add it to your watchlist and see whether this volume can continue.
On the 15m chart it’s up 0.67%, and the volume was pushed straight to 5.26x. The closing price broke above the upper edge of the most recent 20 5m-range interval. But OI is dropping instead—on the 15m -0.01%, on the 1h -0.02%. The abnormal percentile is inverted at 98.6%, and the whole pool is abnormal #3.
Price is rising while positions are decreasing—this is a typical short-covering flow, not fresh long entries. Active trading is also only 1.5%, the buy/sell ratio is 1.03, and there isn’t much appetite for chasing.
With this structure, I generally don’t dare to chase. After the squeeze is pushed up, I’ll wait for the covering to finish and then see the follow-through. In the last 24h, turnover is under 17 million, the pool isn’t deep, so there’s pin-risk and it needs to be accounted for.
First, add it to your watchlist and see whether this volume can continue.