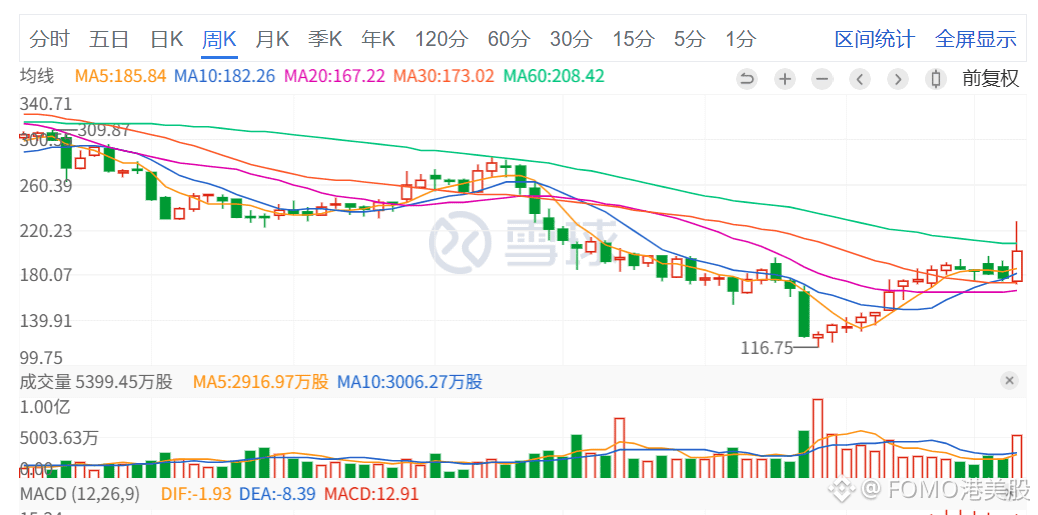
However, the trend of Accenture $ACN can be used as a reference. After a single-week sharp drop, in the second week it sees increased volume, followed by a sustained weak rebound. Then, either an announcement or some news triggers a rebound that is higher than the previous drop point. In other words, the rebound will likely last a relatively long time. Judging from this weekly chart alone, it has taken about three months. $NKE ’s current trend is quite similar to $ACN ’s first half of the year: after the earnings report’s bearish news is realized, it hits a new low in the second week and then, with volume picking up, starts a prolonged rebound path. You can add it to your watchlist for observation.


Post

--
FOMO港美股
·
--
Nike Q1: Gross margin rebound, revenue still falling
Nike $NKE 2027 fiscal year Q1 revenue was $11.213 billion (-4%), net profit was $712 million (-2%), and GAAP diluted EPS was $0.48. North America revenue was $5.127 billion, the only major region showing growth (+2%).
Gross margin rose from 42.2% to 42.8%, mainly due to lower warehousing and logistics costs and cost reductions (-3%), not demand recovery. Note that the full-year adjusted EPS guidance is $1.15 to $1.35—don’t mix it up with this quarter’s $0.48.
The biggest drag is Greater China: revenue fell 22% to $1.180 billion (down 26% at constant currency); Converse fell 28%, and direct-operated stores fell 8%.
In one sentence: This quarter is a period of operational repair, not a new acceleration of growth.
#耐克 #美股财报季来袭 #消费
Nike $NKE 2027 fiscal year Q1 revenue was $11.213 billion (-4%), net profit was $712 million (-2%), and GAAP diluted EPS was $0.48. North America revenue was $5.127 billion, the only major region showing growth (+2%).
Gross margin rose from 42.2% to 42.8%, mainly due to lower warehousing and logistics costs and cost reductions (-3%), not demand recovery. Note that the full-year adjusted EPS guidance is $1.15 to $1.35—don’t mix it up with this quarter’s $0.48.
The biggest drag is Greater China: revenue fell 22% to $1.180 billion (down 26% at constant currency); Converse fell 28%, and direct-operated stores fell 8%.
In one sentence: This quarter is a period of operational repair, not a new acceleration of growth.
#耐克 #美股财报季来袭 #消费